Those Amazing magicians at Seeed Engineering have done it again!
Unboxing the New EARLY RELEASE Seeed Studio Debugger – A Game Changer for Embedded Devs!
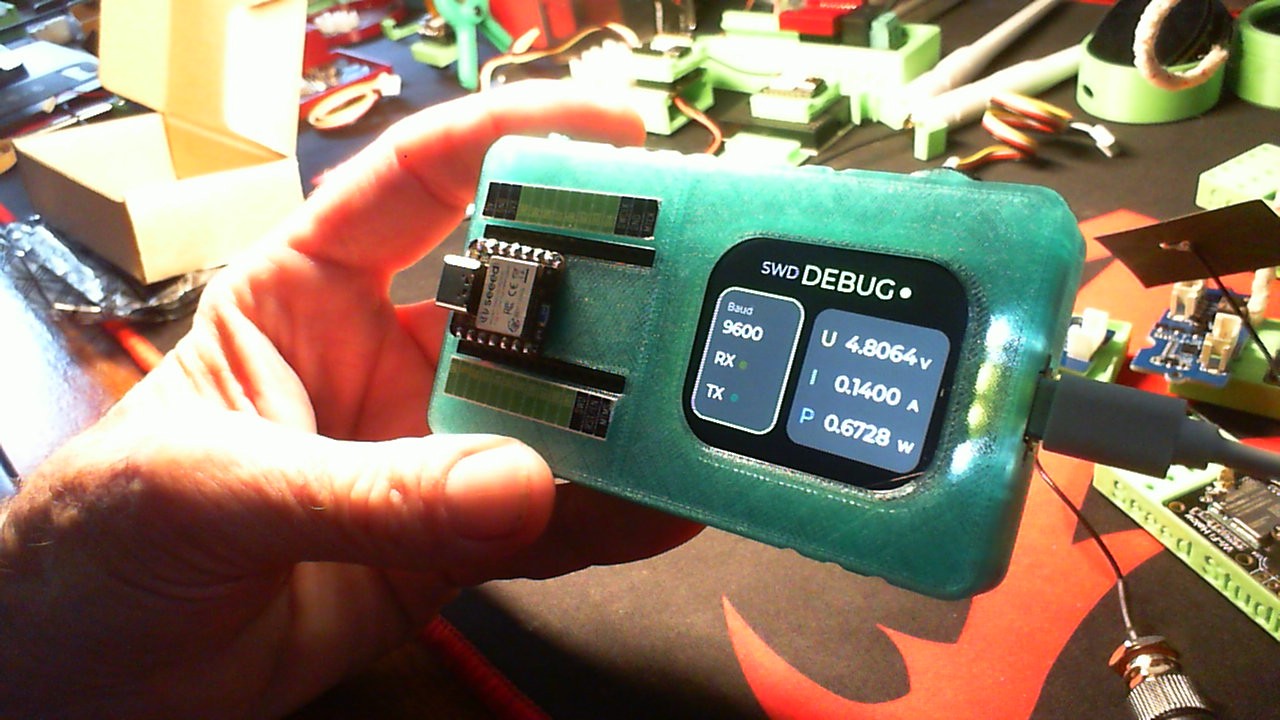
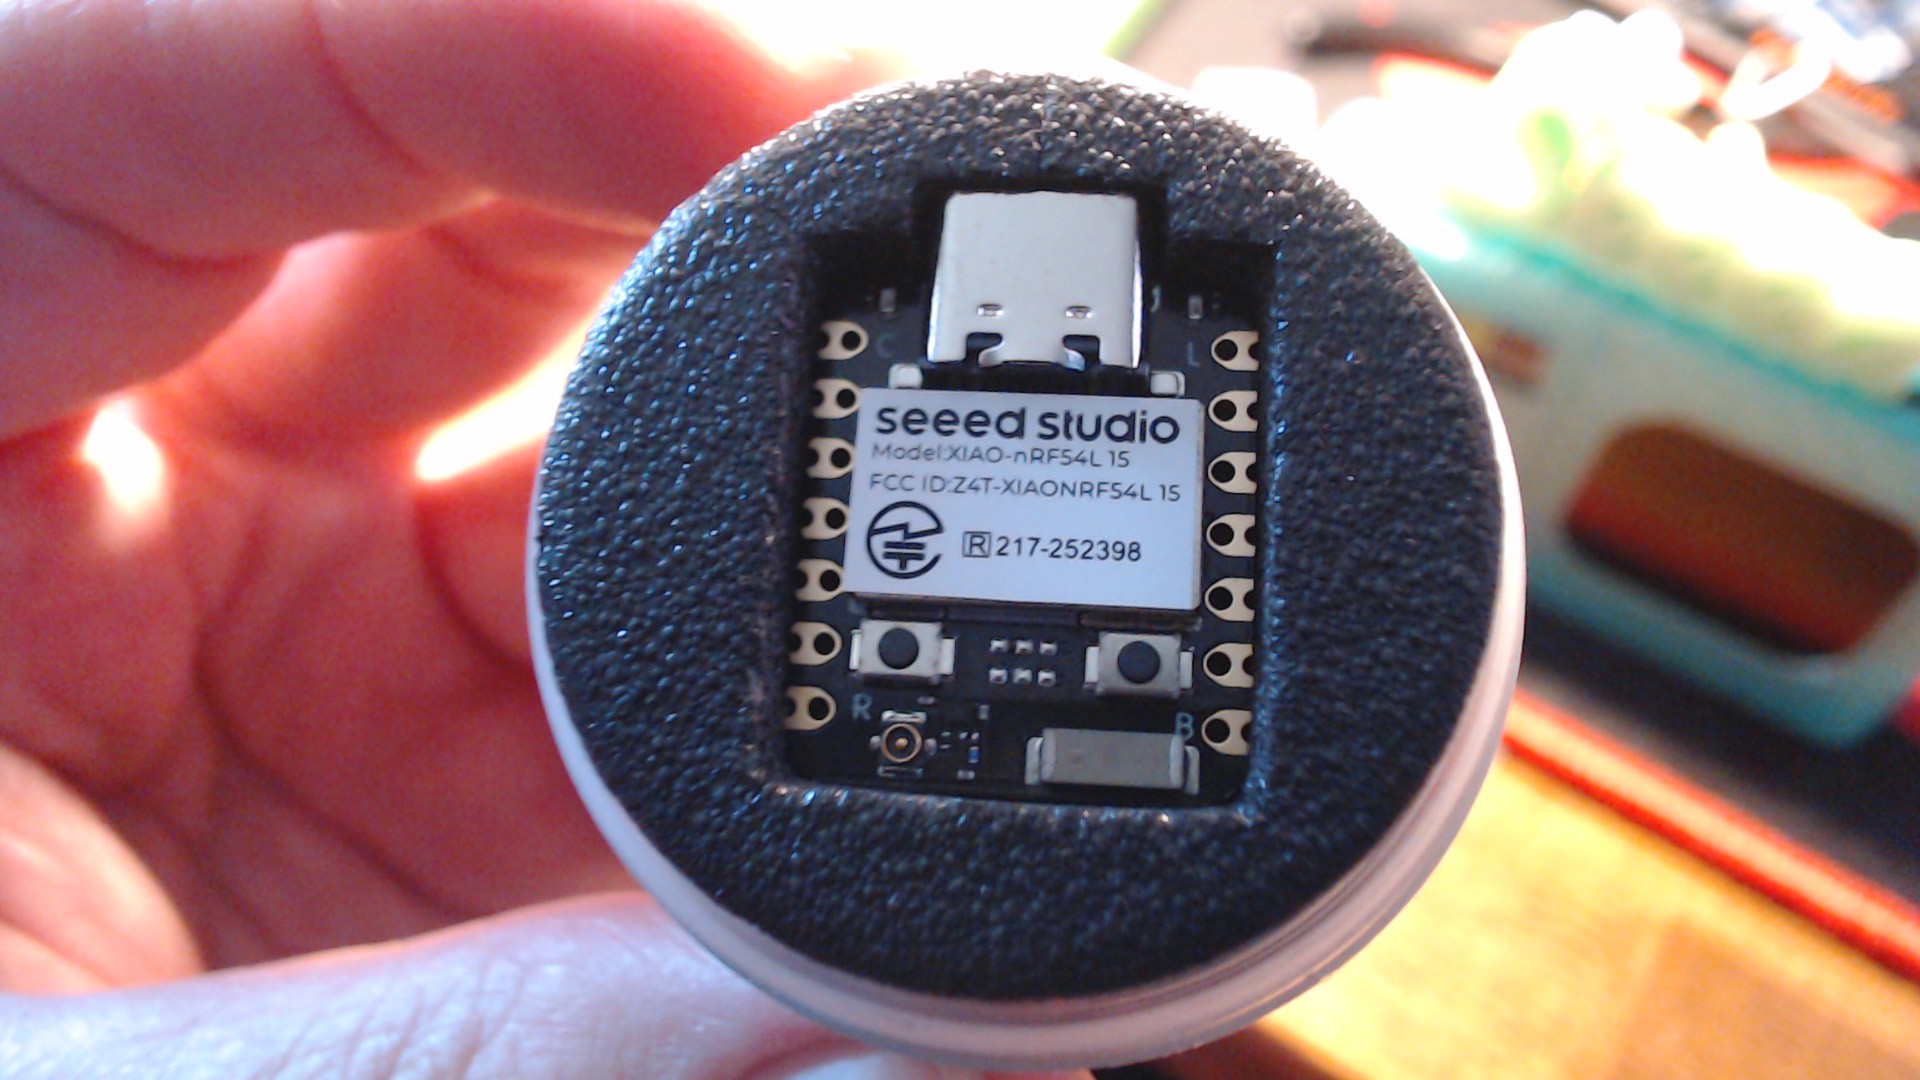
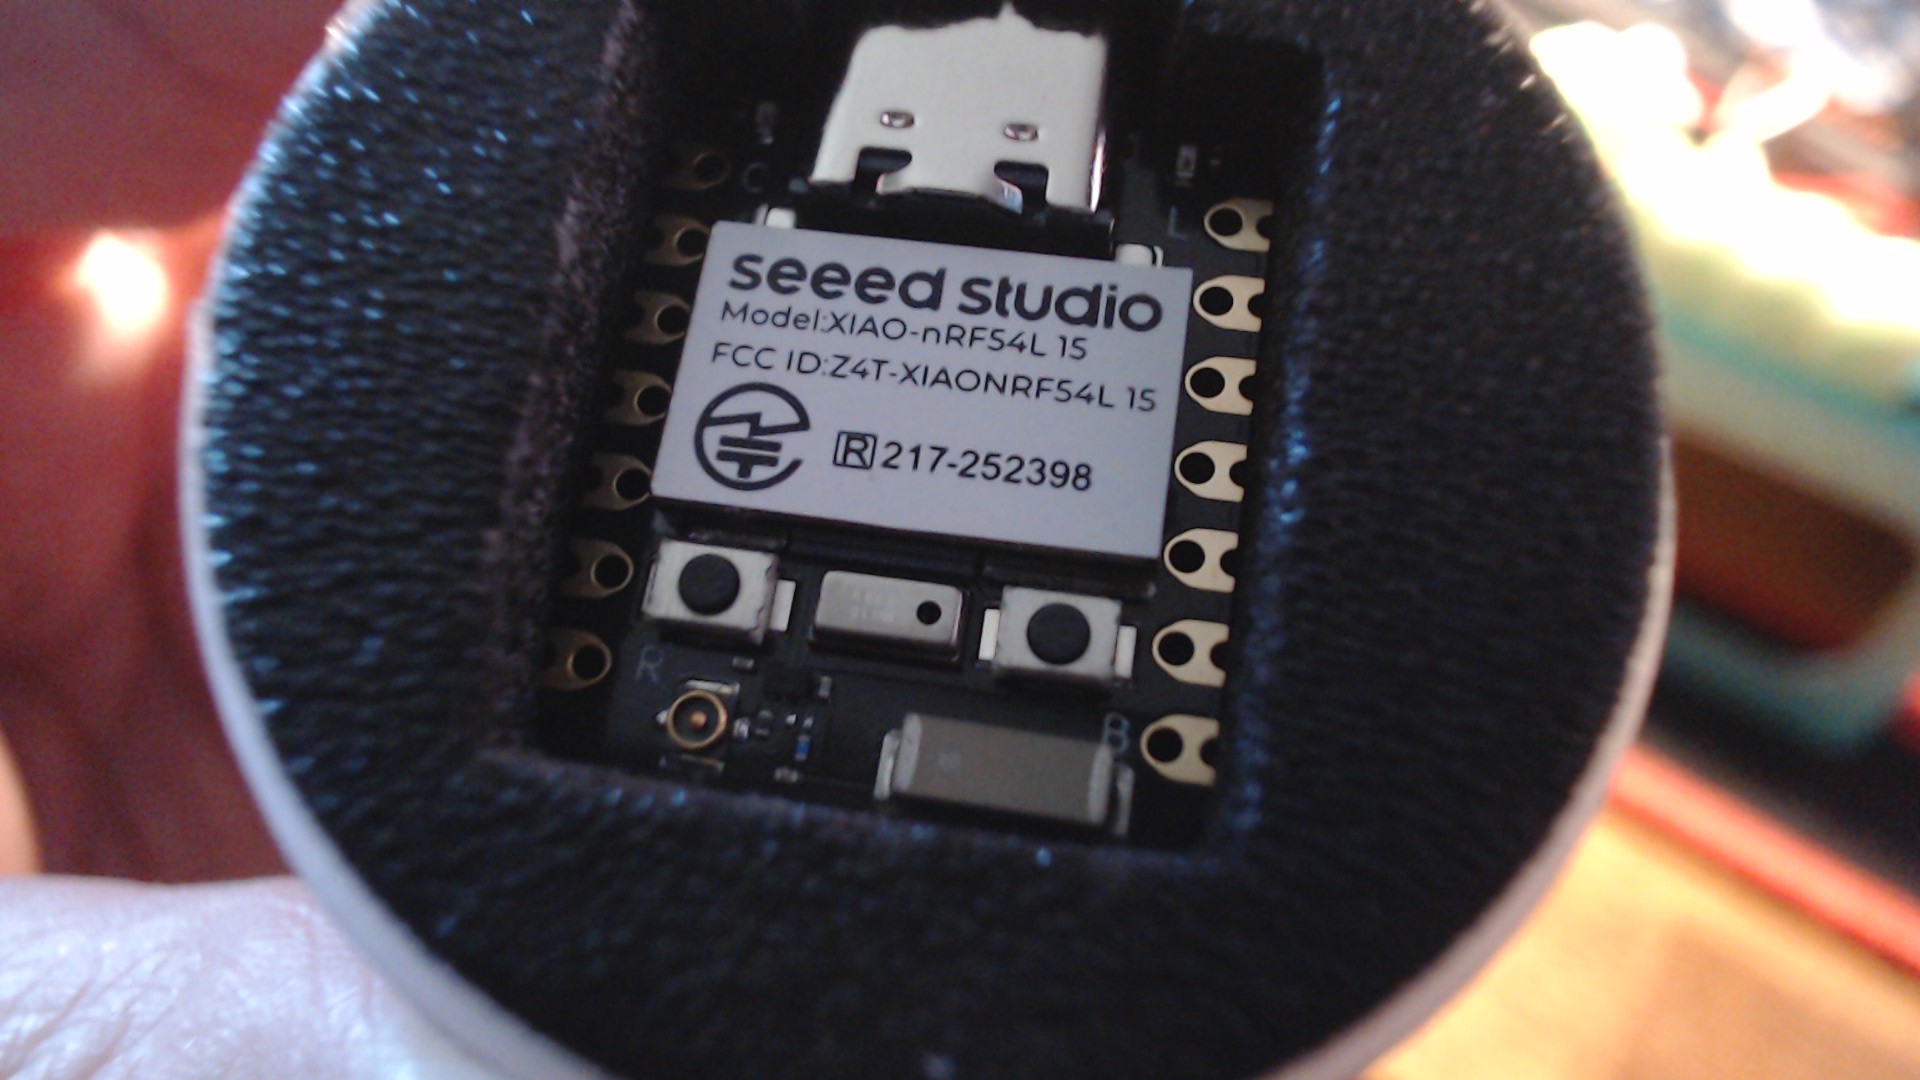
Say hello to the latest tool from the brilliant engineers at Seeed Studio — the Seeed Debugger. This sleek, all-in-one debugging companion packs a crisp display, multiple I/O modes, and serious flexibility into a compact design that feels right at home on any workbench. Whether you’re flashing firmware, analyzing serial logs, or debugging I2C/SPI protocols, this device handles it with style and precision. In this unboxing, we take our first look at what makes this the must-have utility for makers, firmware devs, and hardware hackers alike.
Hands-on demos and real-world use cases — coming soon.
Stay tuned.**
Seeed encourages the community to comment to share more feedback or suggestions for product improvements.
GL PJ
Seeed Game changing debugging support for the Xiao Family Line of MCU’s
Indeed it does…
Wow, really good impression so far. Jog wheel is very Cool too I always was partial to the jog and push to select , clean menu navigation.
yes the device is made to accept the XIAO form factor… I am not sure if it can debug any other devices… as they do not have the pin arrangement to socket in… but also it is capable of accepting jumper wires… so i would say if you connected the appropriate jumper wires to your device… it should in theory work on that device as well
So I was able to get it going after a few cups of joe and this late night.
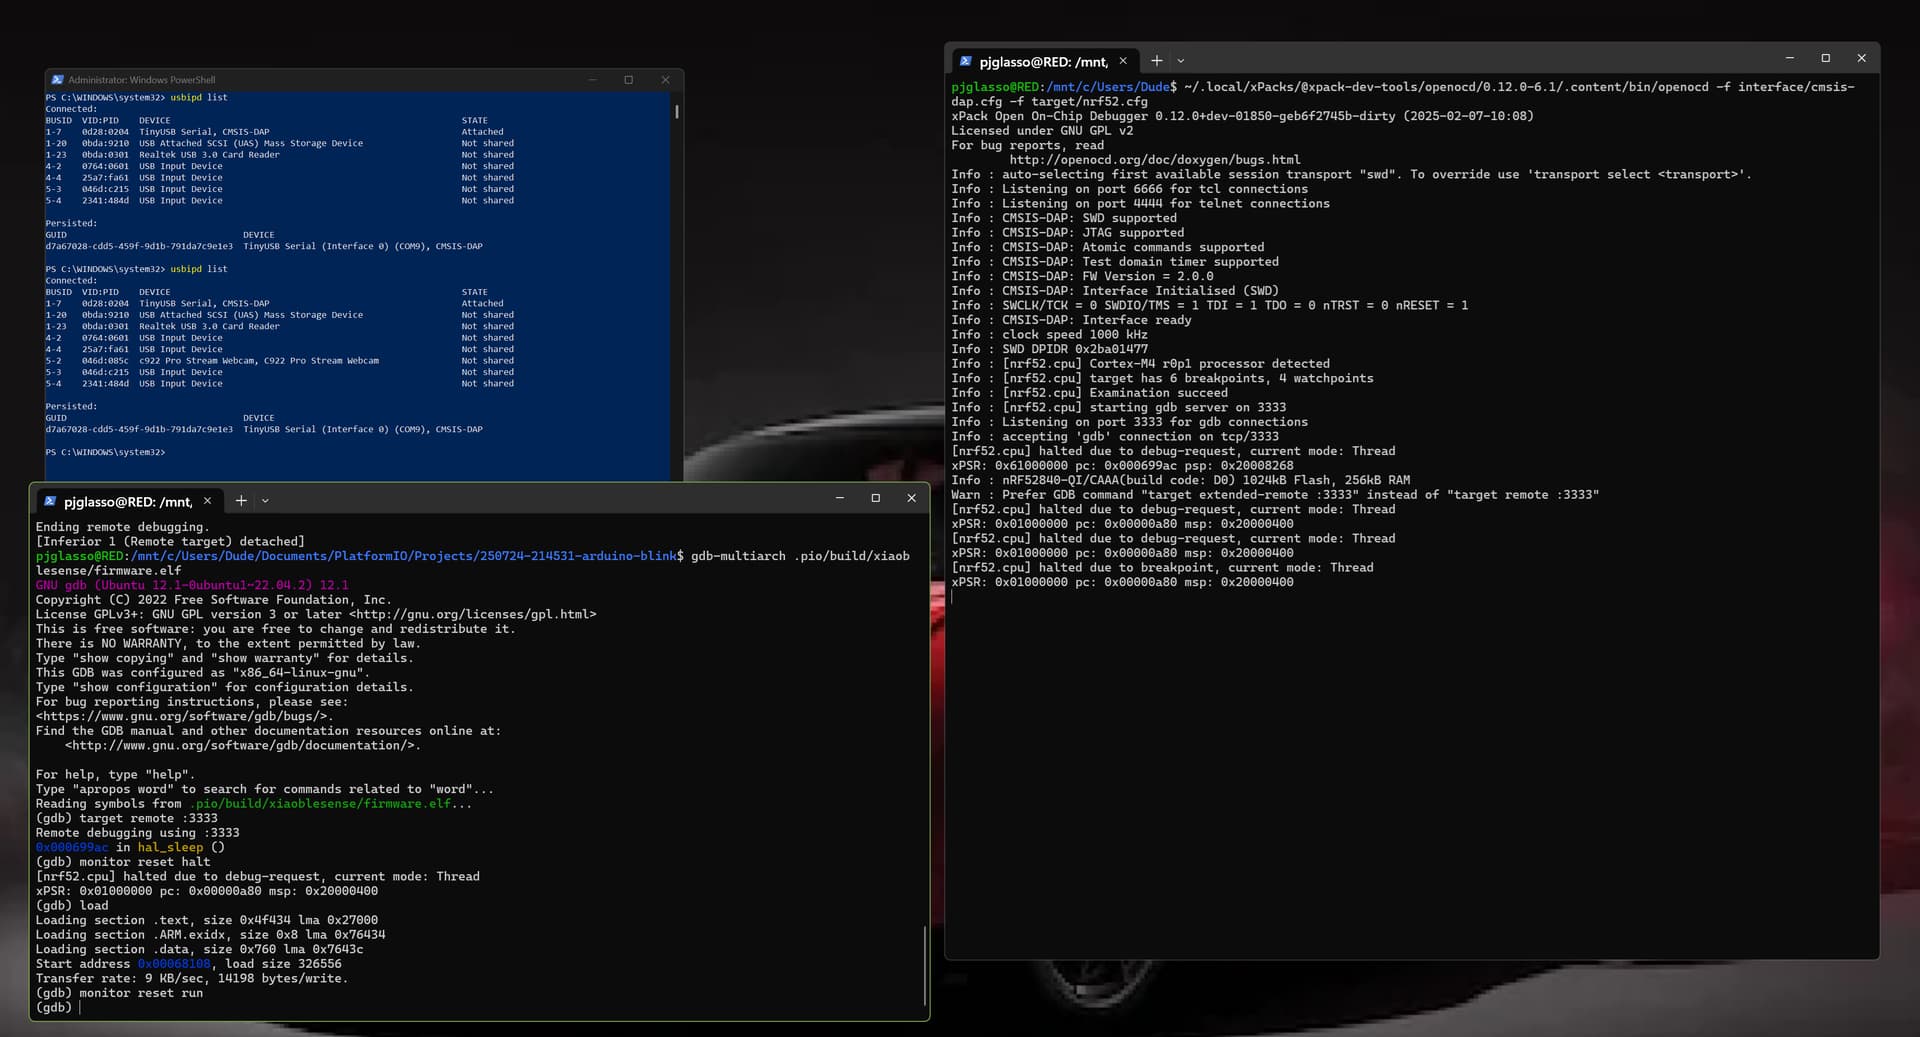
works with both GDB command line debug and with PlatformIO. The trick was NOT to use the OpenOcd builtin to PLIO. Once I set up the generic OpenOcd and the Device manager had the driver for the CMSIS-DAP device (interface 2) as none WinUSB.sys Zidag changed that and BAM! bob is your UNCLE debugger!
I’ll post a video in action but it’s fast , runs the 921600 baud, flashing is turbo quick.
here are the OpenOcd, GDB and PLIO snaps. target was a Xiao Nrf52840 Sense. Single stepping like a BOSS!
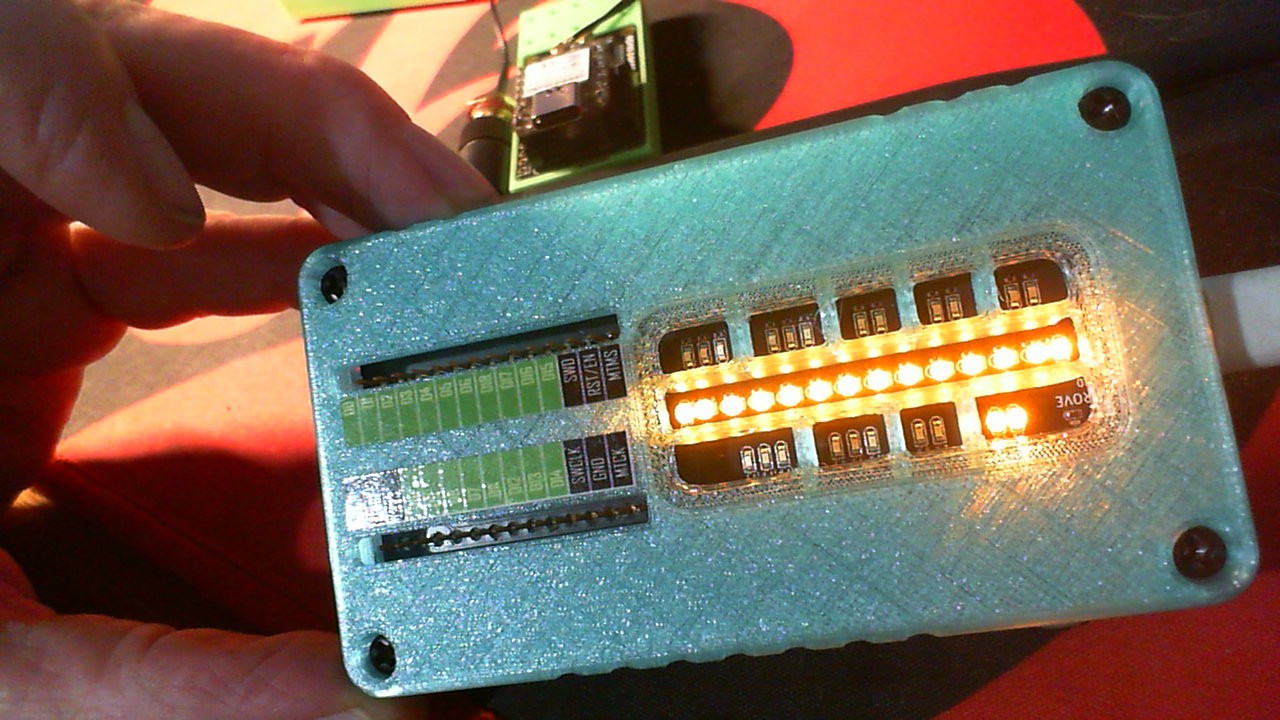
Actually, I’ve hidden a little trick—I’ve exposed the SWD interface. Even if it’s not XIAO, you can still connect your main control board to the Debugger using jumper wires.
The XIAO ESP32 series might not be able to… it’s JTAG-based, and secondly, the ESP32 imposes limitations on the debugging interface. It can be debugged via USB, but if JTAG debugging is enabled, USB debugging will no longer be available.
I know, kinda sux , espressif chose to do that one or the other.
I like that (able to connect external SWD) it is the main feature I used on the Nordic DK , board. connected to the Xiao dev expansion board. worked well.
The PLatformIO version of the OpenOCD is broken, I used external OpenOCD and added it to .ini file like this:
the Blank debug server line Knocks out the built-in Openocd
I use manual debug_load_mode , with edb after I make debug build.
then run Debugger in PLIO as normal. Works GREAT!
It’s a WIP so more to come as time permits
Nordic Connect SDK and PlatformIO (Zephyr) Ready – Seamless support for embedded development workflows (Please do note, these boards are not support with Arduino IDE at the moment)
So once I saw the AI picture, I kinda stopped listening
No date certain on either product the debugger is Very Early in the cycle but the Xiao I think is weeks away or sooner. I still can’t believe my eyes… It is truly amazing what they can manage to do. probably firming up the dev path as there isn’t any arduino support AFAIK so it will be interesting
Say what you want is what I tell others, they are pushing the bar ALWAYS more than a lot of companies in the space just slapping more i/o or a bit more flash with not a lot of efficiency thought going in. This Nrf54L Platform gives it up Like Someone owing you rent money.
it’s been long overdue IMHO.
Hi there,
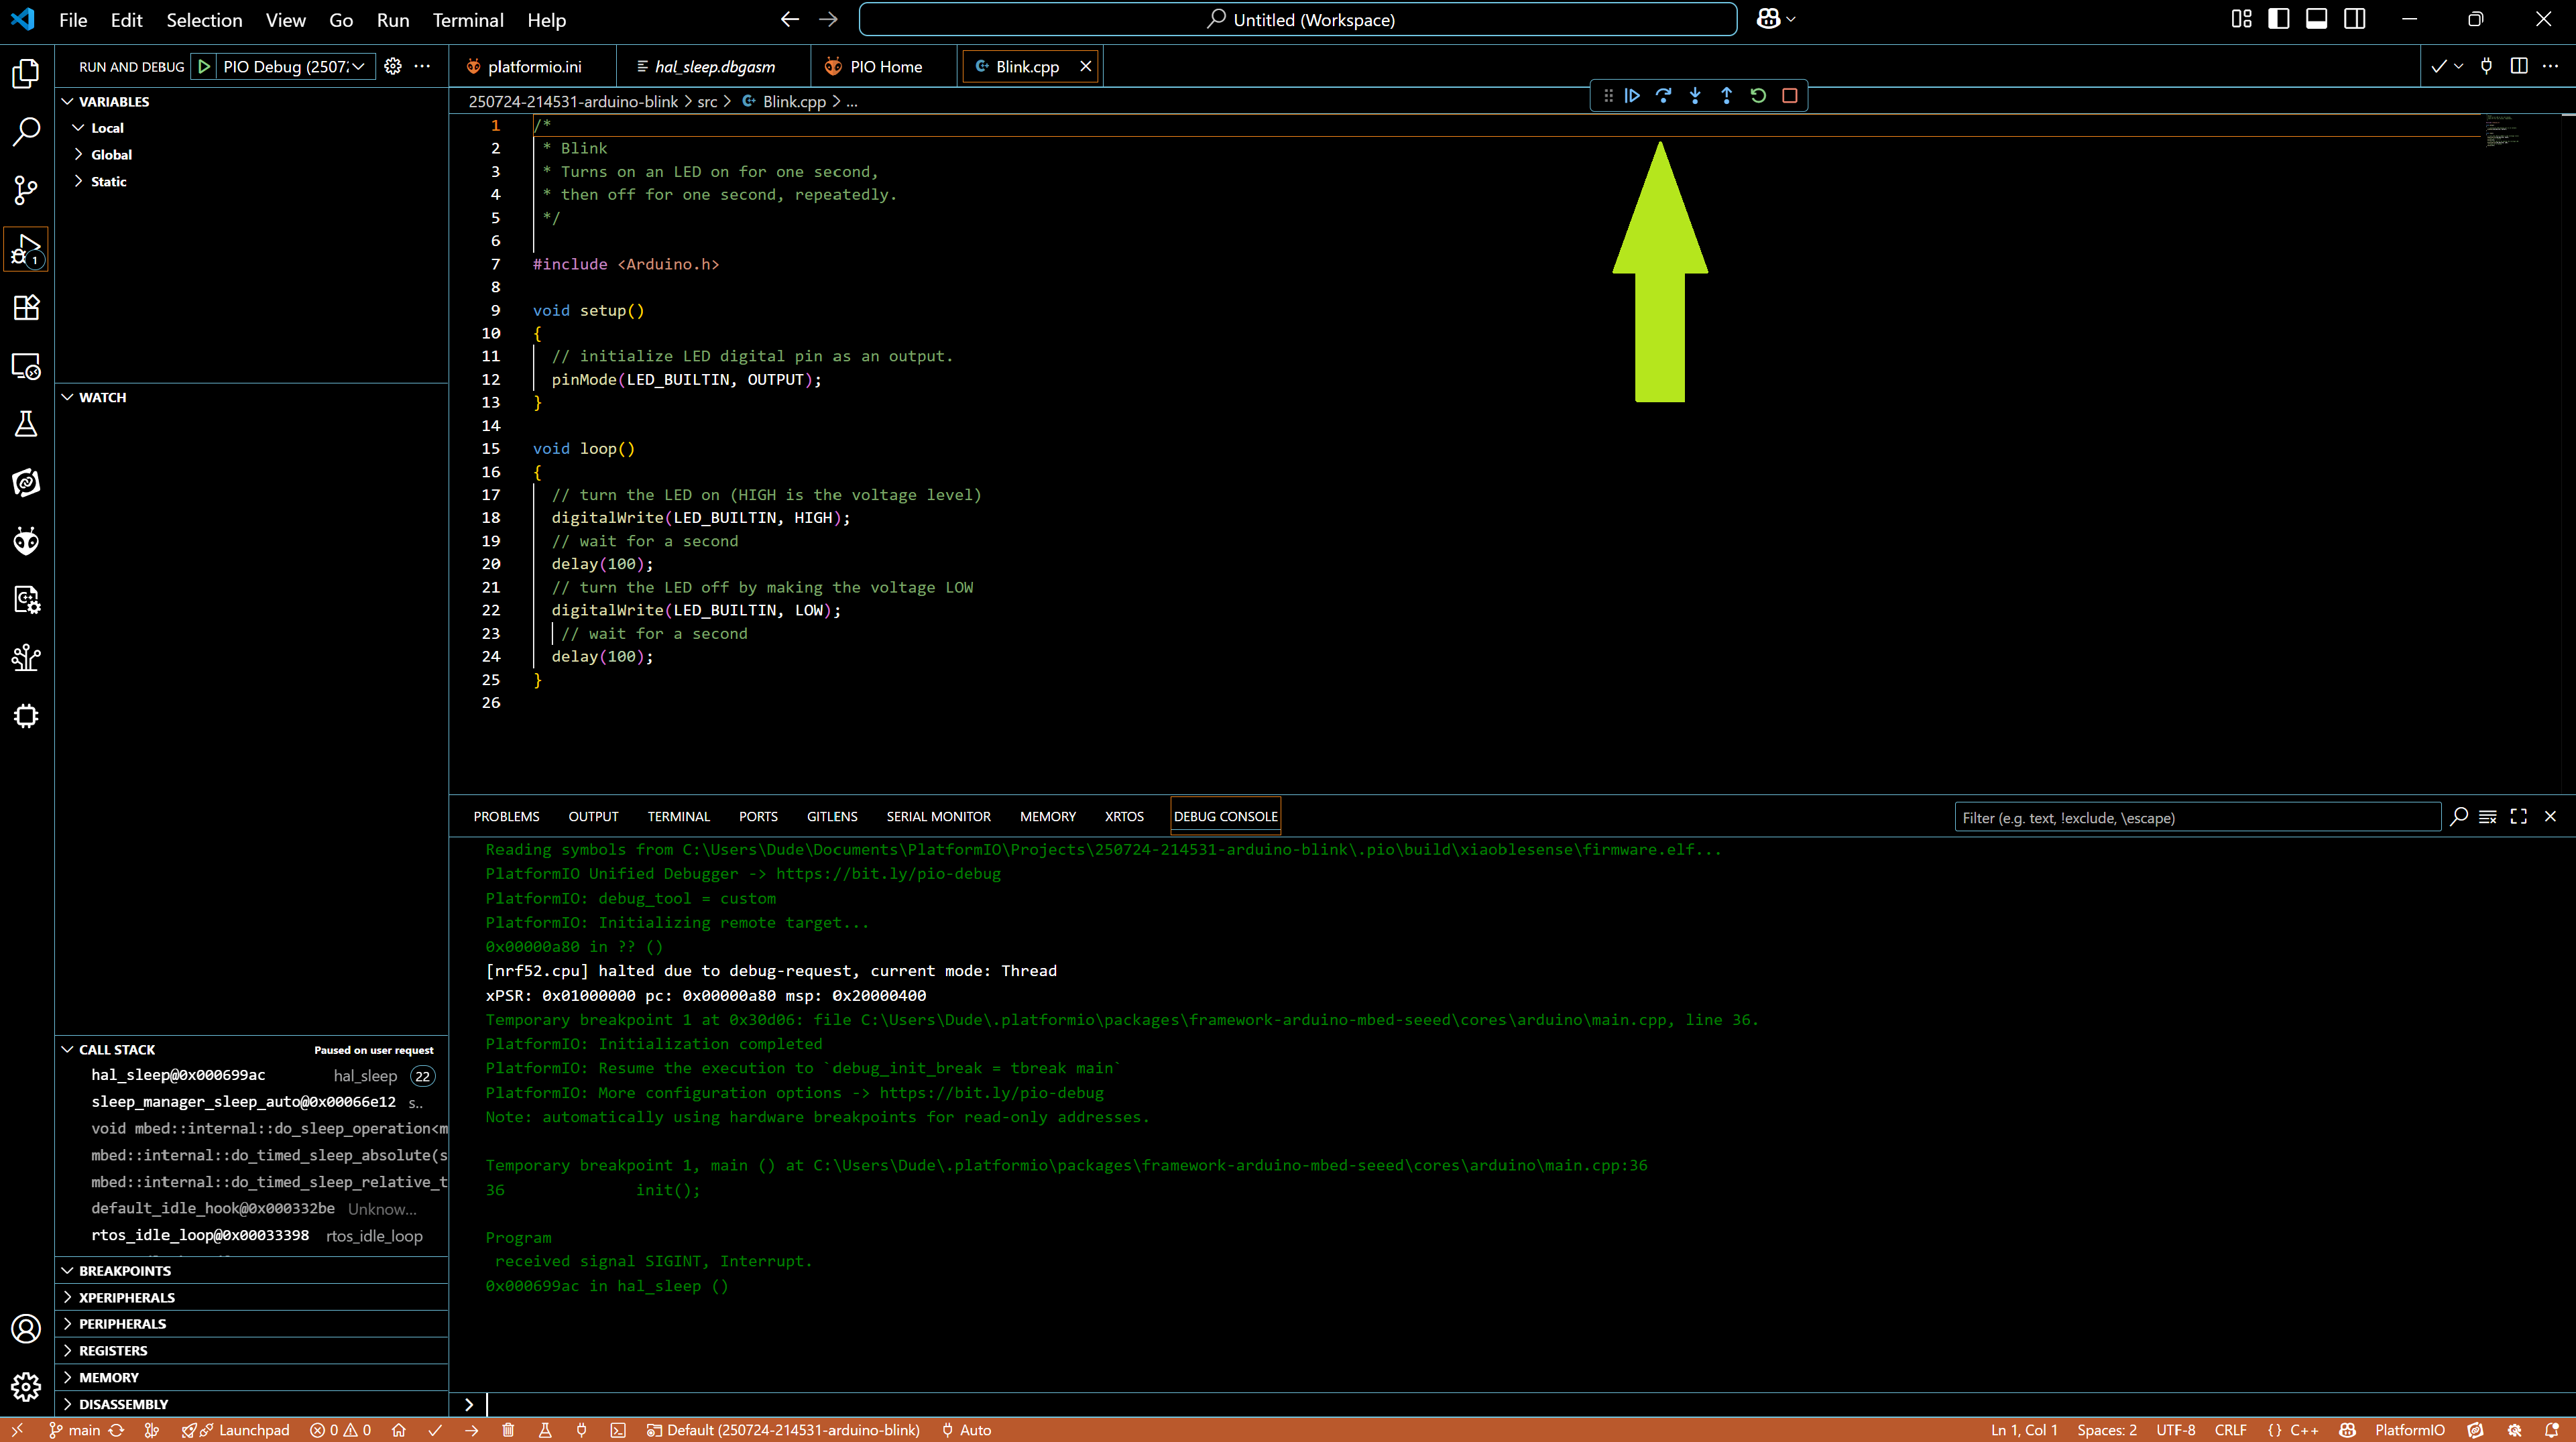
Here is the Xiao family debugger in Operation, showing command line and GUI. Openocd, GDB, PlatformIO (can be used in both) “.pio run -t Upload” and finally Visual Studio & PlatformIO.
How It Works (In Embedded Projects)
You compile your firmware with -g to include debug symbols.
(the PLIO.INI file has a flag to build it with debug)
You connect GDB to a hardware target (e.g. MCU) using a debugger like CMSIS-DAP, ST-Link, or J-Link.
GDB communicates with OpenOCD or a similar server to control the chip over SWD/JTAG.
First up is OpenOCD (Open On-Chip Debugger) is a bridge between your debugger hardware and the CPU or microcontroller you’re trying to debug. It acts as the middleware that allows tools like GDB, PlatformIO, or VSCode to communicate with chips over JTAG or SWD (Serial Wire Debug).
Next…
is GDB (GNU Debugger) is a powerful debugging tool used by developers to inspect and control the execution of programs on supported architectures like ARM, x86, RISC-V, and more.
GDB lets you:
Start and stop a program (pause, continue, reset)
Set breakpoints to pause at specific lines of code
Step through code line-by-line or instruction-by-instruction
Inspect variables and memory
Modify variables or registers during runtime
Watch expressions and see when values change
Analyze crashes by examining stack traces, registers, or core dumps
Enjoy…
Typical Workflow:
Start OpenOCD with a config that matches your MCU and debugger.