My need sounds fairly simple:
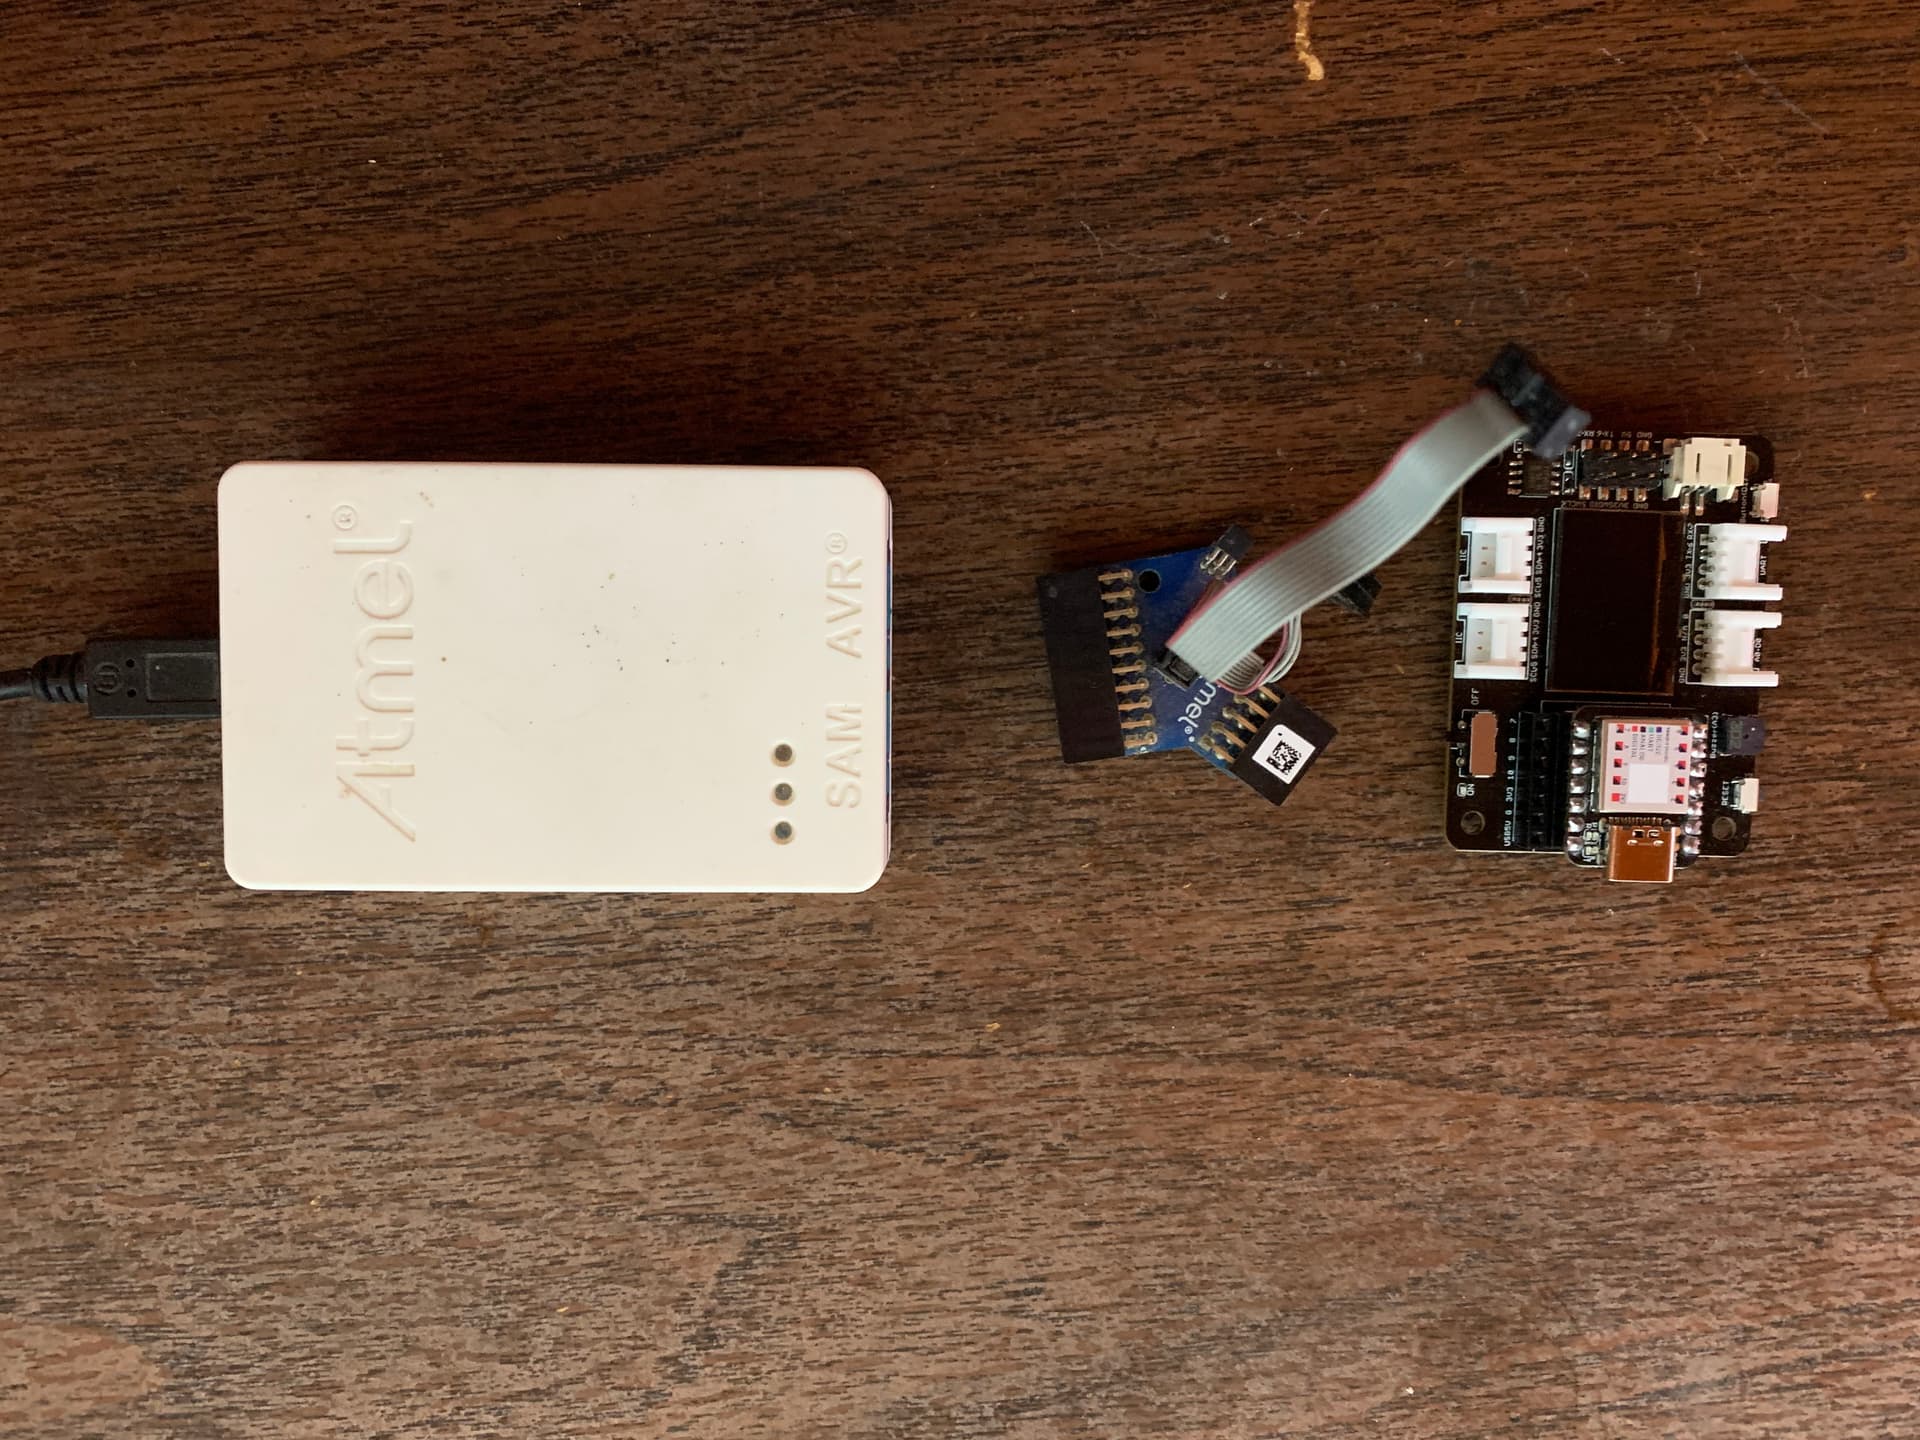
Connect my Atmel-ICE to my XIAO SAMD21(18) that is sitting on the Seeed Xiao Expansion board so I can set a breakpoint in VS Code and hit it.
My experience is with Atmel ATMega MCUs using Atmel Studio as my IDE. It is a simple matter to connect the ICE to my ATMega MCU board from the AVR header on the ICE to my JTAG header on my MCU board. Then - in Atmel Studio, select Atmel ICE as my debugger and go. Everything just works.
I need the same simplicity with the Xiao system.
Right now I have VS Code running platformio extension and I can connect to the USB port of the Xiao board and I can write, upload and run code just fine. But now I need to add hardware debugging to the mix.
My questions are:
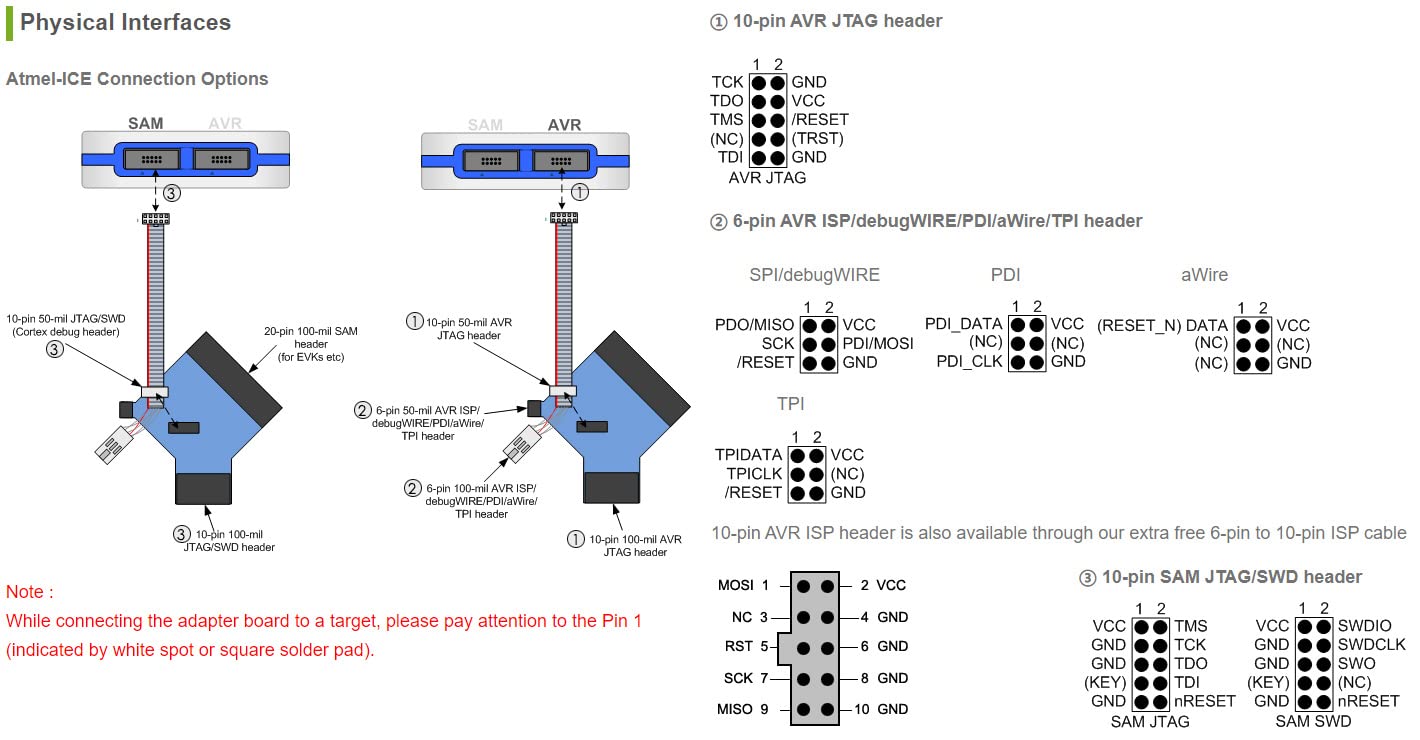
What pins on the Atmel ICE connect to what pins on the Xiao Expansion board to make this possible? On the expansion board I see:
Gnd
3V
5V
SWDIO
SWCLK
TX-6 (Uart I presume)
RX-7 (Uart I presume)
What config files need setup in VS Code?
Is VS Code a proper IDE to use for this or should I use some other (Arduino for example)?
The image shows the XIAO components I wish to debug.
several posts on connecting up the “SWDIO” or SWD method are on here give those a look at a minimum.
Once connected and viewable in the Atmel App. Then PlatformIO will have some programmer menu populated , pick it, click a break point and GO!
YMMV based on your skill level and New Hardware Adaptability.
Are you able to compile in PLIO?
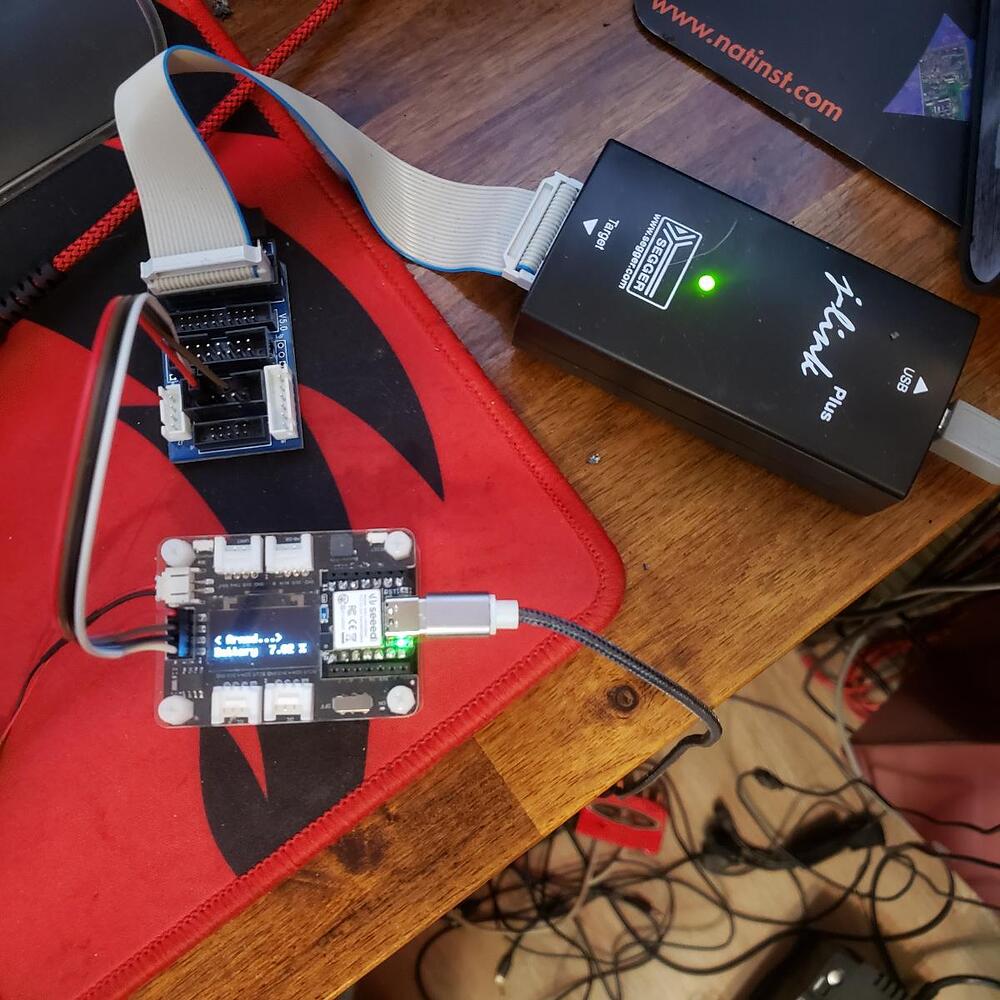
I have a link on here with it some what documented. I’m using a Jlink , doesn’t really matter IMO same need different automobiles.