I am new to development with XIAO ESP32C3 board. I would like information about DEBUG. I didn’t understand why I need another hardware even though I have USB/JTAG. Could you inform me about this? I am very grateful!
Hi, OsvaldoTCF:
In principle, there should be no need for another hardware, and under the premise of ensuring the normal operation of the power supply circuit, crystal oscillator circuit and reset circuit, debugging can be carried out through the JTAG interface
After the system is powered on, the output waveform of the corresponding pin of xiao can be checked through the oscilloscope to determine whether it is working normally. Under the condition that xiao is working normally, ADS or SDT can be used to access and control the components in the chip through the JTAG interface.
Here, you can first try to drive the IO port to verify that the ADS debug environment is set up correctly and that the connection to the JTAG interface is normal by manipulating the special function register that controls the universal I/O port on the chip.
Hello. Many thanks for the feedback!
I would like information on why I have the same indicators as other cards regarding USB and JTAG but I cannot use DEBUG just using the USB CABLE.
Another point, could you give me a link with information on how to make links with other boards for DEBUG?
I’m a newbie!
Thank you very much.
Hi,OsvaldoTCF:
Debugging methods besides JTAG and USB, Port, etc. But I am good at JTAG, ha ha ha.
I can provide some of my personal steps on connecting to the debug board:
1. Power on the development board and connect the development board to the computer with a serial cable or USB-to-serial cable
2. Install the usb serial port to drive
3. Open the device manager to check the serial port status
4. Use the serial debugging tool Xshell and connect the corresponding protocol for serial debugging (there may be more intermediate steps, such as selecting the appropriate encoding ASCII, selecting the corresponding serial port and transmission baud rate)
5. Finally connect
I can’t give you proper advice on the aspects of application writing and cross-compiling, but I hope my reply will be helpful to you!
Thank you very much.
As I said in another conversation, access to the D+ and D- pins underneath is pretty annoying.
With seeed studio it gets worse.
I’m developing with a Lolin C3 Pico (just plug in the usb and that’s it!) and then I load the program on XIAO.
In another post I asked this, I really don’t understand this question.
I would like to know why I can’t just use my usb cable, as the ESP32C3 chip allows me to do this and other cards work just fine!
I think this is a design problem of xiao itself, because its size is very small, unlike other chips in the design of the “body” has a lot of positions, it has a lot of chips are not integrated such as: ttl to usb. “everything have two siez” may be saying that, in its low power consumption and small size, but also has different other problems
I’m new to working with the XIAO ESP32C3 board and I’m thrilled to dive into the world of microcontroller development. I’ve come across a bit of confusion when it comes to debugging. I’ve noticed that the XIAO ESP32C3 supports USB/JTAG for programming, but I’m unsure about its role in debugging. I understand that USB/JTAG can be used for flashing my code onto the board, I’m not clear on whether it can also be used for real-time debugging. Do I need additional hardware or components to enable debugging functionality?
Hello, thanks for your feedback, JTAG for esp32 is a interface for you to debug with the variable at the kernel level, but the serial is only support the result of the function output. USB/JTAG of esp32c3 is a build in hardware in module, so you can just use the usb to try it, only you for using it by usb is the openocd you should download by the tutorial here: Set up OpenOCD for Windows — ESP-IDF Programming Guide v3.3 documentation
Hello, you can read my answer below your question
you need an additional hardware for debugging, such as JTAG debugger, it provide low level access to microcontroller operation, allowing you to step code, set breakpoints and inspect memory in real points which is not possible by using simply USB.JTAG interface.
![]()
What the Sam hill is going on here, beside the spam this is SO NOT TRUE…
You better either contact espressif and tell them ![]() or GO RTFM…
or GO RTFM…
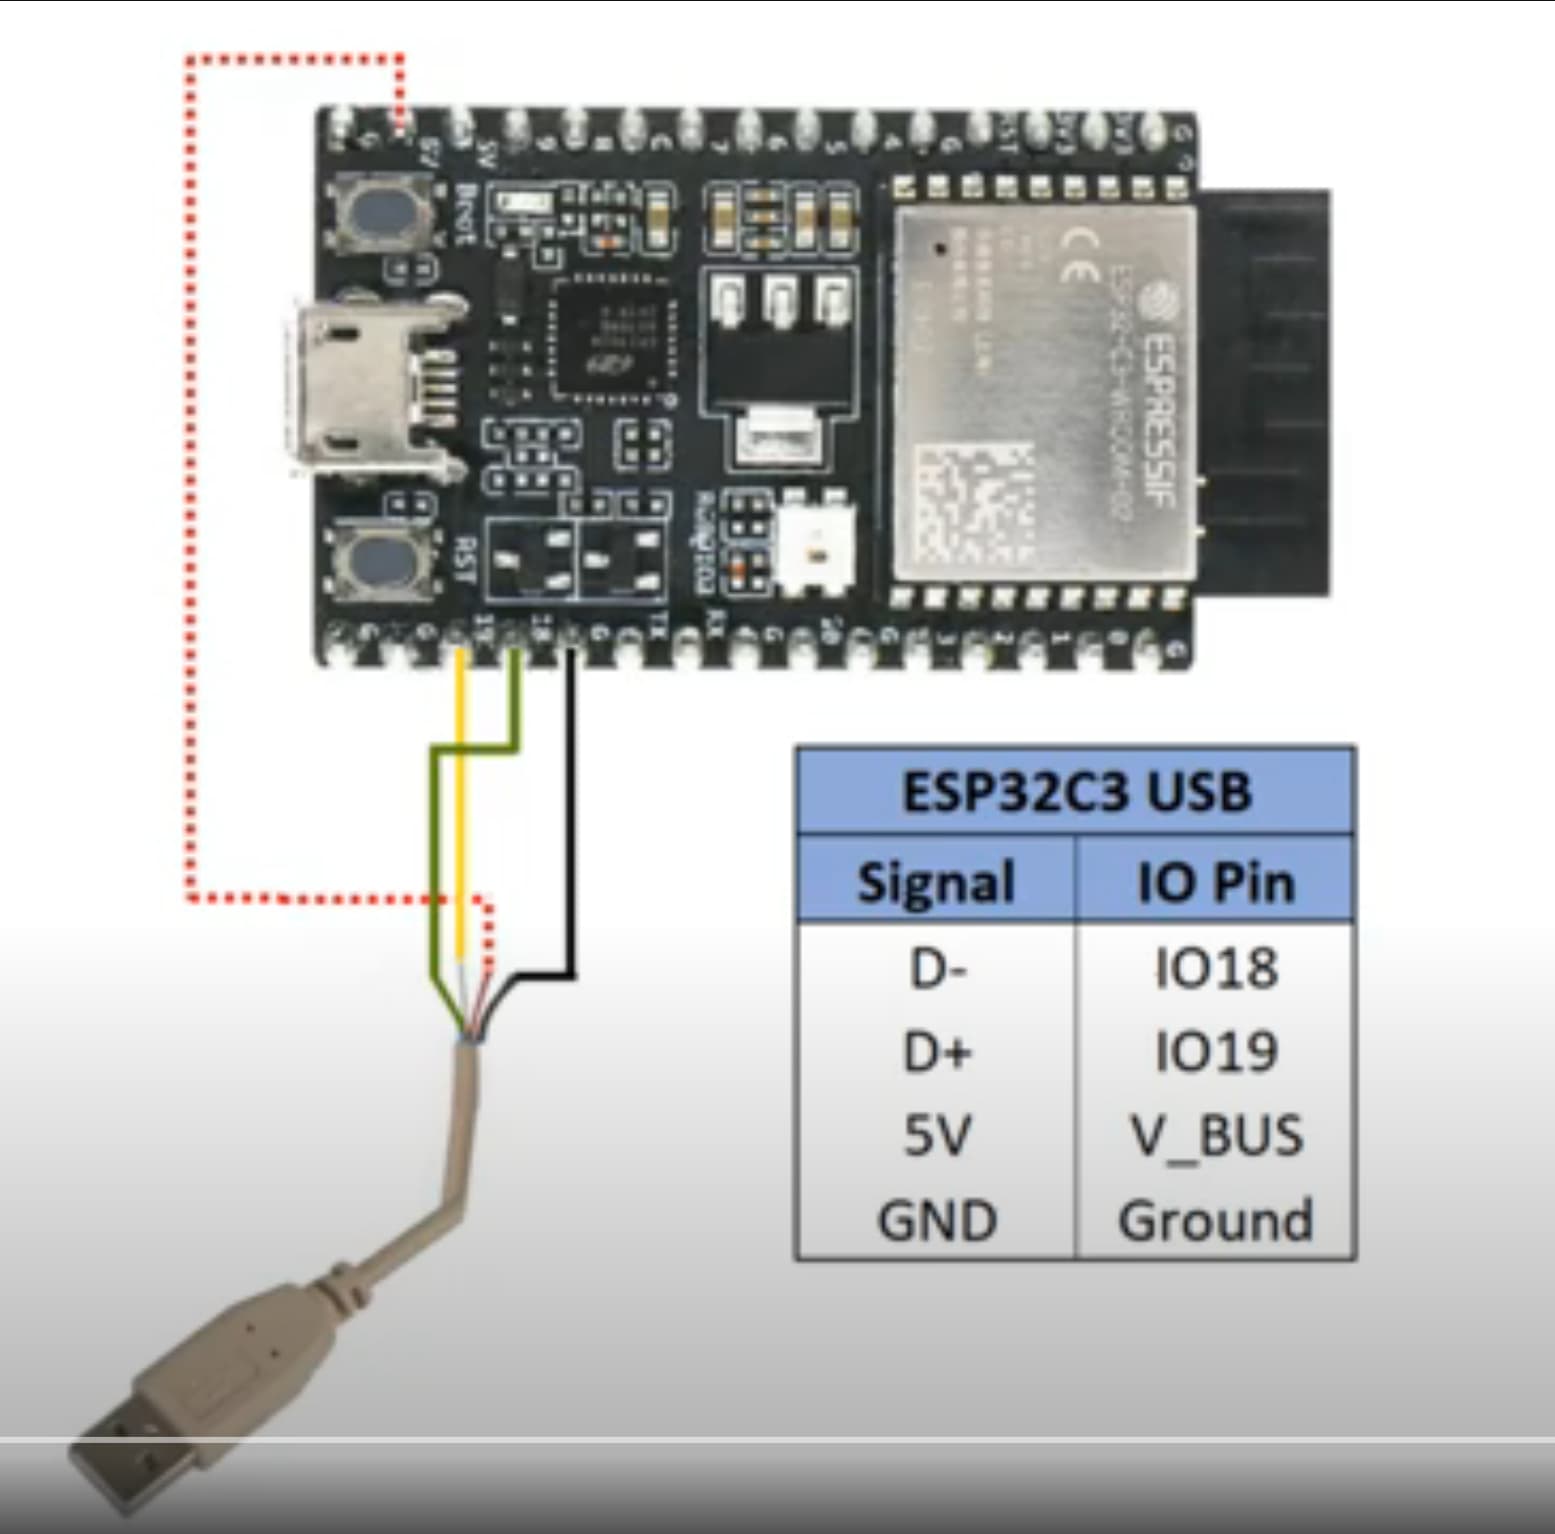
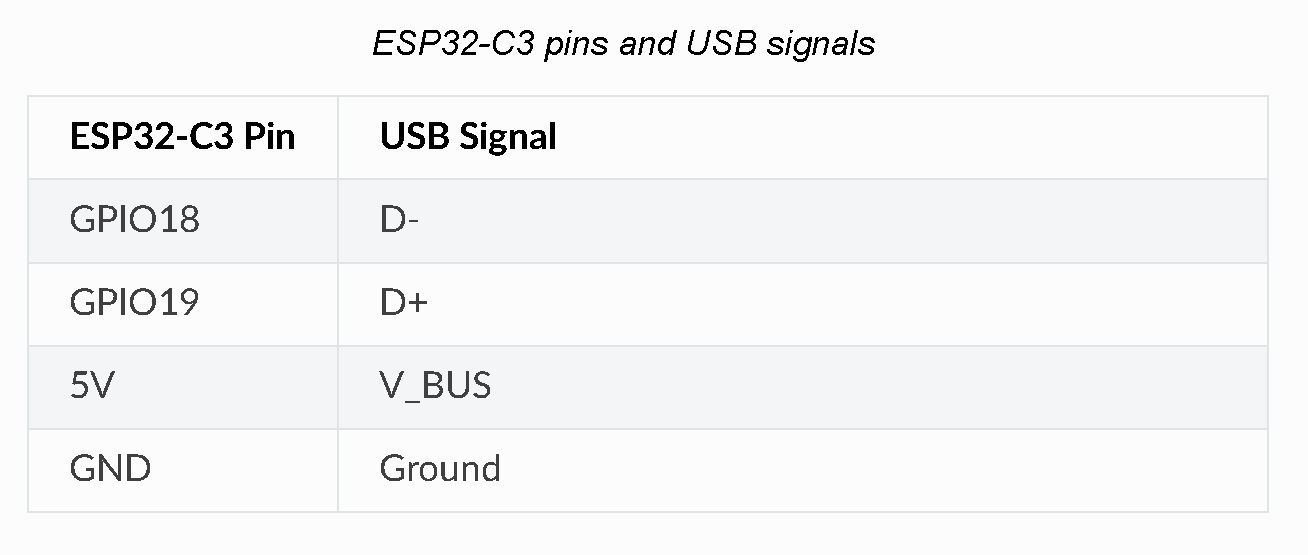
The ESP32C3 contains everything you would need to do the Breakpoints as well as everything else too. Stop/Start/Single Step MCU. What they do require you to do is if you use this method The code still gets uploaded via the USB-C port. ![]()
Further, If you want to use a Hardware probe like a ESP-Prog You certainly can , with a conventional Jtag Connect as well.
The Gotcha is You must blow some register fuses and it’s a onetime and done, always and forever becomes default or selectable to enable it. I pick selectable is what happens.
Go watch this video, Do you have a ESP-Prog?
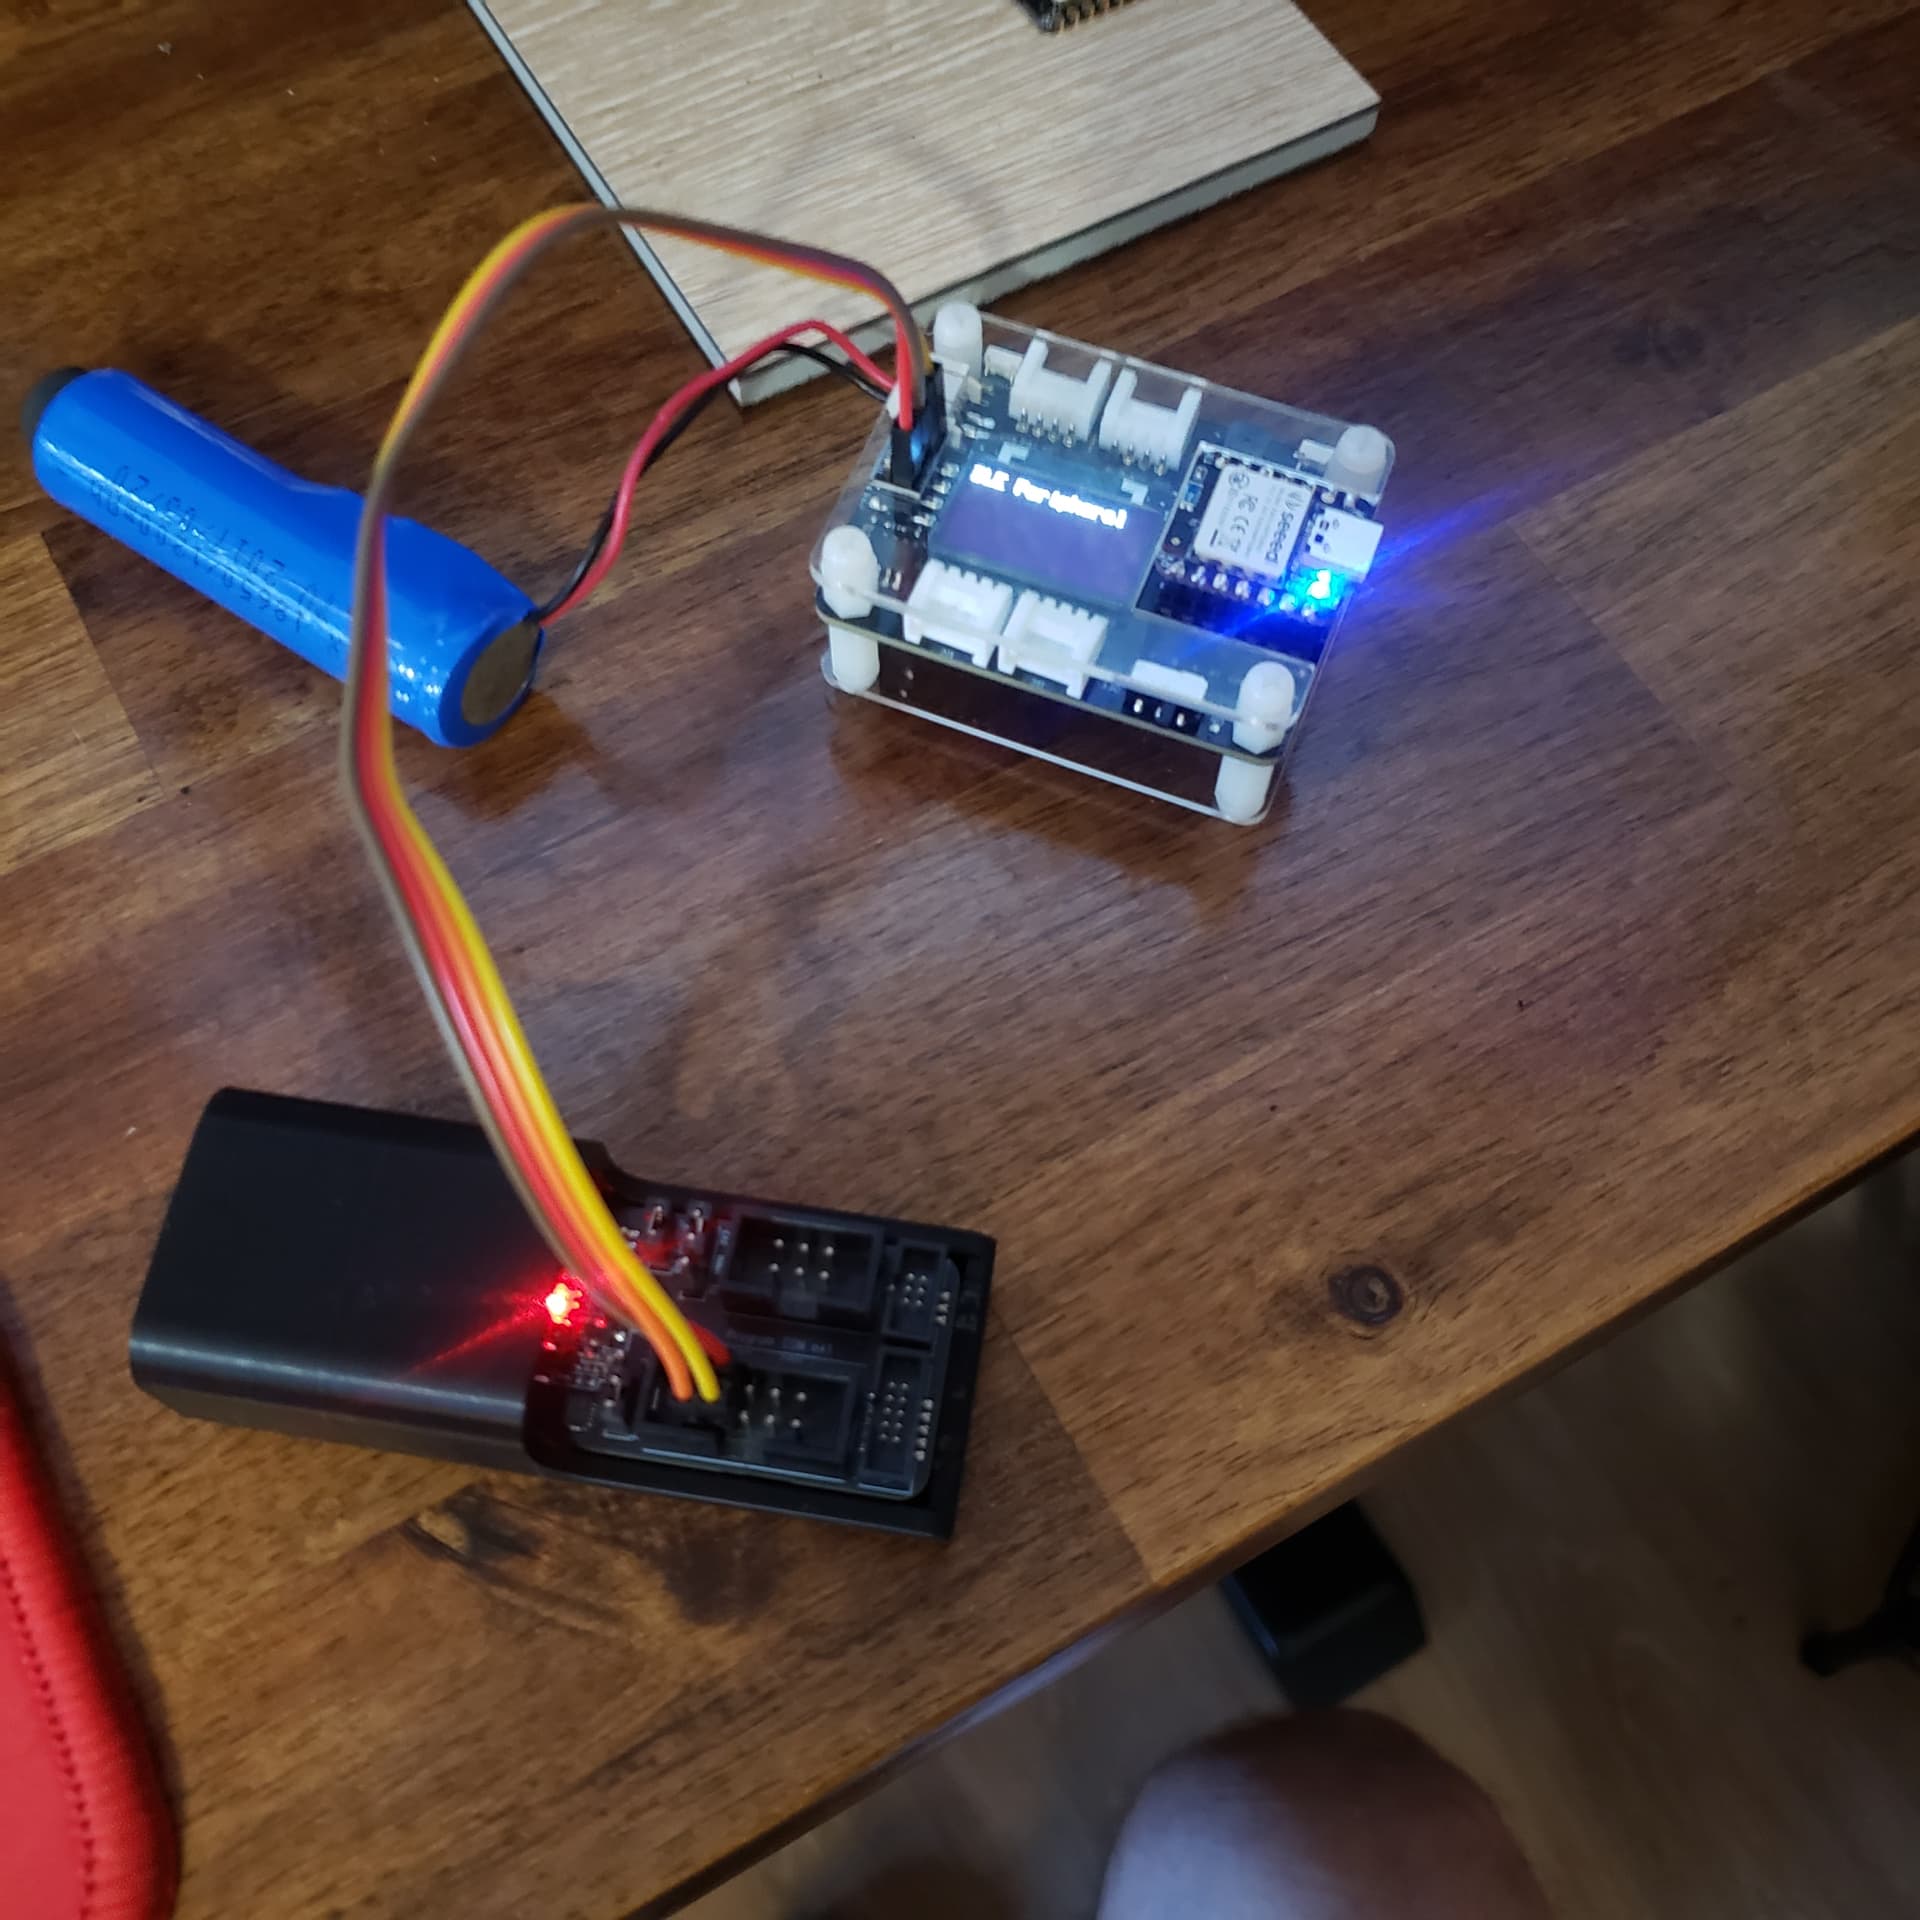
like this?
and The OP is not the first person to ask about it. What you provided was incorrect.
You both could have searched and found the answers are YES and YES.
HTH
GL
this cable