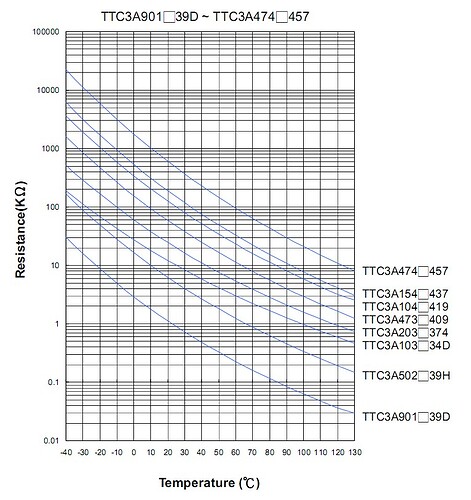
I would have to agree that the temperature sensor in the brick line is rather difficult to find the right values for. It certainly may be easier to use a more linear one. However, this one can be tamed to produce good results. With my limited equipment, I am finding that my measurements are about .2 degrees off on F and .1 on C (I don’t know which is right, my lab thermometer or this brick temperature sensor). Again, if you looking for something extremely accurate, a more linear sensor can be found. But, this is close enough for my uses.
These are what I am using:
For Fahrenheit:
250 = 34.3 degrees F 700 = 111.0 degrees F
For Celsius:
250 = 1.3 degrees C 700 = 43.9 degrees C
Here is the code I am using for Celsius:
Original code is over at arduino.cc/ I changed it to reflect this particular sensor.
This code assumes you are connecting the Temperature sensor to A1 on the Brick Chassis. If you put it somewhere else, you will need to change the port your pulling data from. You will need to change the red colored port below to the one you change it too.Additionally, I connected the led sensor to D12 on the Brick Chassis to see the read and write process. If you add the LED sensor to a different port, you will need to change that assignment as well.
void toggle(int x)
{
if (digitalRead(x) == HIGH)
digitalWrite(x, LOW);
else
digitalWrite(x, HIGH);
}
void setup()
{
Serial.begin(57600);
Serial.println(“Serial Connection Ready”);
}
void loop()
{
float x = map(analogRead(1),250,700,13,439); // analog pin reads 250-700, corresponds to 1.3C to 43.9C
x /= 10.0; // divide by 10; map() uses integers
Serial.println(x); // output to serial
toggle(12); // toggle LED
delay(1000); // wait 1 second
}
Here is the code I am using for Fahrenheit:
Original code is over at arduino.cc/ I changed it to reflect this particular sensor.
This code assumes you are connecting the Temperature sensor to A1 on the Brick Chassis. If you put it somewhere else, you will need to change the port your pulling data from. You will need to change the red colored port below to the one you change it too. Additionally, I connected the led sensor to D12 on the Brick Chassis to see the read and write process. If you add the LED sensor to a different port, you will need to change that assignment as well.
void toggle(int x)
{
if (digitalRead(x) == HIGH)
digitalWrite(x, LOW);
else
digitalWrite(x, HIGH);
}
void setup()
{
Serial.begin(57600);
Serial.println(“Serial Connection is Ready”);
}
void loop()
{
float x = map(analogRead(1),250,700,343,1110); // analog pin reads 250-700, corresponds to 34.3F to 111.0F
x /= 10; // divide by 10; map() uses integers
Serial.println(x); // output to serial
toggle(12); // toggle LED
delay(1000); // wait 1 second
}
