DSO Quad bandwidth

:astonished: The length of these posts demonstrates the complexity of these discussions.

I was implying that less than fastest T/Div selections could result in less than maximum samples-per-second of data capture resolution. This will be further explained in this post. It is very strange that I have NOT been able to find the fastest T/Div capability of the DSO Quad in the specs. Could someone look at their Quad and tell me the fasted T/Div setting available?

We are all trying to learn what we are talking about too! :smiley: We are trying to apply our collective limited knowledge to understand, so welcome to the club. In your scope pictures you have 0.5us selected. That is your T/Div = 0.5us selection item in the menu system. What you can’t see is that the T/Div selection may reduce the sample rate. This is because the firmware reduces sample rate (automatically) as you increase T/Div. This is done by the firmware to prevent sample buffer overrun because of too many samples (there is only buffer ram space for 4K samples with both analog channels activated).

As the time per division display of captured data increases (resulting in more time for more samples), then so must the sample rate decrease to prevent capture buffer overrun during that acquisition event. For your benefit an acquisition is simply the accumulation of those 4K sample data points for each trigger event. Each acquisition takes time and this time is mostly based upon the T/Div selection. Once this data capture is completed, then the rest of this acquisition is devoted to very quickly updating the display with the new acquisition data results (new waveform display) for that capture interval, and preparing for the next trigger condition that will stimulate the next acquisition.

Thanks for providing those good screen shots. I must say that this signal is lousy by my standards, and on my engineering model (prior to v2.6 circuit board, that I no longer have) my 3.5Mhz signal was much better looking (an actual square wave was displayed (with some sampling error)). Item (4) below may explain the difference.

I also want to thank you for that link emcsociety.org/Presentations … 0Radar.pdf (first 26 pages) and I will explain why that link is so important.

  1. All your waveforms are taken with channel “B” hidden which is reasonable to get the maximum sample rate. The rub is that according to this link, and reports from other Forum threads, the Quad has an ADC interleave problem.

  2. I had not considered a clock phase shift problem as a source of the Quad’s interleave problem. I was leaning towards front end ground level and gain differences, but it could also be based upon clock signal propagation phase shift between the FPGA (also within the FPGA) and the ADC chip clock lines. The ADC is physically very close to the FPGA so that is a good start. We don’t have access to the FPGA source code so we don’t know the phase shift relationship of clock signals out on pins 100 and 81. I think it would have been smarter to have used complimentary output pins to eliminate FPGA substrate phase shifts, and they may have; I just can’t tell at this time.

Even with no phasing errors of the two clocks leaving the FPGA, there is still the issue of propagation delay due to circuit board trace parameters. Because we don’t have the board design parameters, then we can’t be sure of the circuit board trace impedences and trace lengths being the same for both clocks. If they are different then that could also cause the ADC interleave problem. The clock signal of 144Mhz requires some serious circuit board trace layout considerations to prevent unexpected propagation delays and reflections.

  1. If we want to discuss band-width issues, then the faulty ADC interleave must be removed from the displayed results and this discussion. So keep both channels A & B enabled for all band-with testing until the interleave problem has been corrected.

  2. Another interesting link contribution addresses how the rise time of the measured signal influences the DSO results. I seem to recall back when I had the engineering model Quad, that the nice square wave from the signal generator looked terrible on the display but my function generator signal of same amplitude and frequency looked much better. Now I know why: the rise time of the function generator was most likely much longer and this according to the link would result in a better looking DSO display. This is what caused the large difference of my test results versus “Vernarim” test results while using a square wave signal. I hope you are reading this “Vernarim” because that means we were both right about what we saw on the display. :blush:

  3. Another interesting link contribution on page 7/88 demonstrates how 5x sample rate is barely acceptable while 10x and 20x are much better. 2x sample rate is simply inadequate.

In summary, that link (first 26 pages only, the remaining pages deal with time-domain reflectometry) cleared up a lot of issues for me, and I now have a better DSO understanding because of that link.

To make your measurements complete, you must also provide the amplitude output of the Quad signal generator (using a separate scope) for each frequency just to make sure that the signal generator output is stable in amplitude. Remember, you are only looking at sample points connected with straight lines on the Quad display, so if your sample points never coincide with the peak signal value, then you will never see the peak signal value displayed. This may be the source of the displayed amplitude errors and not representative of analog band-width.

I realize that you were using square waves but we know that a square wave consists of the fundamental sine wave plus all its odd order harmonic sine waves. The attachment to this post is an animated gif that came from an unknown internet source and I modified it in size and slowed it down for the fundamental, 3rd harmonic and 5th harmonic so you can see how peak sample points could easily be missed. Notice how the rise time gets steeper as more odd harmonics are applied to the square wave.

That flat top of the square wave is virtual and composed of a cluster of frequencies (harmonics) so what are the odds that you are sampling on all the peak points? Remember, the trigger condition sets the relationship of the samples phasing with regard to the input signal. If you move the trigger level you should see different waveform results, because the sample phasing of the input signal will change and the odds of sampling a waveform peak also change.

If you look back at my original sine wave drawings, you can see how the amplitude is reduced when the sample is at less than peak position of the input signal, and nearly all the sample points missed the sine wave peaks. With fewer samples per waveform, then these missed peak amplitude samples become more likely. These are the reasons I can’t definitively answer your question. What are the odds that your samples are occurring at the waveform peaks? The answer is probably slim to none with reduced amplitude results. You could ask BenF how the measured peak values are determined by the DSO Nano because that may be how the DSO Quad measures Vpp.

In closing, I expended several hours in researching and writing this post, and I hope that others will take the time to read and understand what I have said here. Is it absolute? Probably not, but it is a good collection of issues that must be considered before determining the analog band-width capabilities of the DSO Quad by using it’s displayed output.

It is unfortunate that several different threads are skirting around in these issues without considering the other threads with similar issues. Maybe this post will help others to recognize all the interactions that can affect the displayed results on the DSO Quad.
SquareWaveSmall2.gif

Hi lygra.
I read the latest posts right now, but I am not sure to understand everything well…Okay, I am actually tired too.

I was not able to perform any other test because I am very busy at the moment. The instrumentation is in the lab, while at home I can only try with simple circuits.
Anyway, I would like to create a simple circuit using HCMOS logic, that is performing very well even at tens of MHz. That will allow me to test something at home.
I understand that many users has no good wave reference, but the internal wave generator of the DSO shouldn’t used as a reference to test the scope itself.
To tell the truth, I didn’t check it at all, because that is a section not so interesting for me.
I will do…

Considerations?
I think that the current version of DSO has several failures: the problem is NOT just one.
Pros:
the idea is valuable and the price is good;
the circuitry is using good components, that perform very well (anyway I’d used a faster+powerful MCU);
(if will be) the ability to interface with a PC;

Cons:
(overall) the DSO has been designed too in-a-hurry: that is the most evident fault at-a-glance;
the box should have been bigger: the display is OK, but the buttons are very hard to push/slide;
the analog section is likely under the real possibilities of the ADC/logic;
the trigger algorithm is faulty/buggy;
it should have been an analog trigger detection also: the digital seems not enough smart even for signals relatively “easy” to trigger;
by using a better MCU several functions could have been easier to implement and/or expand.

I would love to explore the circuit of the DSO, with the instrumentation. I’d like to make many tests better and deeper, as well to try to improve the analog section.
The problem is the usual: I have no time!
I can’t promise anything, but I will try to do it in the near future.
Cheers

Hi Lygra!

Thanks very much for your help. I’m digesting what you wrote in your long post. Hopefully get some bits of them.

On my DSO quad, the fastest TDiv is 0.1us. The quad software has bug in this Tdiv settings. It doesn’t refresh the screen properly when the signal changes frequency.

Why do they have to reduce the sample rate when they increase the time div?
Assume the buffer can store 4000 samples. When they reduce the time div (or increase the sample rate), they can still capture 4000 samples, and only need to display these 4000 samples. Obviously, this 4000 samples can only capture a shorter length of the signal, but on the screen we also has to display less because of smaller t div. Correct?

when I re-enabled channel B, the wave still looks sine, but now it has 16 steps or more instead of 8 steps. The wave immediately looks better right after enabling channel B. Could you explain what this ADC interleave is? Is it the ADC taken sequentially between each channels and not at the same time?

Can we use an external scope and look at this?

Maybe I should try using a signal generated from another better scope :slight_smile:.

If we use 10x sample rate as standard, then 3.6MHz should be the bandwidth? or is it 1/10 of 15MHz that Hugeman was mentioning?

Thanks. Yeah, using the quad to test itself shouldn’t be trusted.

This is interesting. I’ve never seen it before and would never understood it. It’s not that I’m understanding it clearly now, but it’s something new I learn from you. I’m wondering if the ADC input has some sort of low pass filters then we see only the low frequency harmonics, right?

The odd of the ADC sampling only on the peak points would be great if the sample rate is low. So when the frequency of the signal we want to measure getting close to the sample rate, then yeah, we don’t know, and we can’t reproduce an exact wave form either. I mean we just don’t know what we see is true or not.

Thanks Lygra

-Thanh

I am not qualified to provide an exact correct answer for this complex question. The attached JPG file is an excerpt from BenF’s “Nano User’s Guide” that demonstrates what I have said. Although the actual sample rate numbers are different, the sample rate decreases will be similar. It is clear here that as T/Div increases, then Samples/sec are decreased. Maybe you can get BenF to provide further explanation.

Just what you have said, first one ADC takes a sample and then the other ADC takes a sample. Each ADC places it’s sample into the common capture buffer (I guess, unless two separate buffers are merged at the end of that acquisition cycle).

Only if your external scope is very fast with very stable trigger circuits. Looking at the phase comparison and/or phase jitter of two 75Mhz clock signals is certainly no walk in the park.

Original 36Mhz ADC clock would display a 3.6Mhz square wave with some distortion, and I would compare this to the spec statement by Seeed Studio as analog-sampling-bandwidth. This would mean that a little bit of square wave sampling distortion would be expected and would be similar to 3-db amplitude roll-off distortion for any true analog band-width. I am NOT using the term analog-band-width.

With the overclocking of the ADCs, then 75MSa/s and 144MSa/s would result in analog-sampling-band-widths of 7.5Mhz and 14.4 Mhz respectively, which approaches 15Mhz number represented by Hugeman.

There is no intentional low-pass filter at the ADC. As shown in the animated square wave creation file, with 15Mhz DSO input limit, then to get just the first 3 odd harmonics (fundamental, 1st, 3rd, 5th harmonics) would require an analog band-pass of 75Mhz and the edges would still not be very sharp and the tops would not be flat. Sampling of this 3 harmonic input would result in a poorly shaped square wave on the Quad Nano display.

Hi thanh & lygra,

The buffer is used to compute avg, rms, dc, ac, frequency, period… If your buffer is filled always at same sampling rate you’ll lose a lot of precisión in those calculations. Besides, going from 0.1us/div to 1us/div and your buffer samples are just in the limit to fill the screen.

Analog bandwidth and sampling rate should not be mixed. Analog bandwidth is constant for all T/divs (the exact quantity is unknown to me, but about 2MHz -see previous posts-) at least in this scope. It defines the frequency at which the signal is attenuated by 3 dB. It works like a low pass filter.

Obviously the signal has to be sampled adequately in order to display the signal properly. A 20x oversampled signal looks much better than a x10 one. But that has nothing to do with analog bandwidth. Benf has already shown that with a 1 Msps (DSO V1), controlling the sampling interval and trigger, you could have higher signal resolution (equivalent sampling speeds higher than ADC maximum). All of this is possible if signal has some periodic pattern.

Hope it helps

ok, this afternoon , I tested the Quad , here is what i found.

  1. what is the bandwidth of the analog input channel?
    From the connector to U5_pin13 and U16 _pin13 ,it is 10M .
    lots of reasons for this .for example, the parasitic capacity around the U5 and U16, it is very distinct.
  2. what is the sample rate ?
    The max sample rate is 72M/s when T/div is 0.1us. Although we are seeking to make the sample rate to 144M when the other channel is unenabled, but now ,it seems not work .
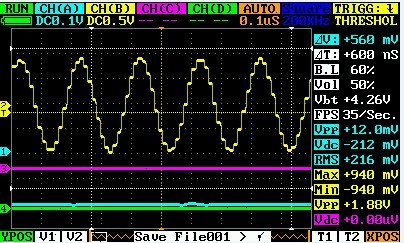
    as in this picture , the signal is 5M. and you can see about 14 points in a period. so the sample rate is 72M ,and if the CHA was hiden, this wave mess up.
    /..jpg.jpg
    2.jpg
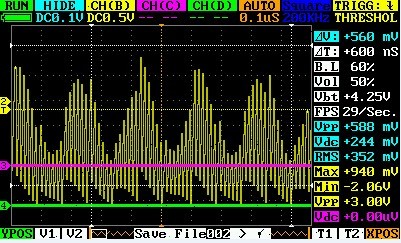
    as the 10M signal , the gain becomes about -6db. so , i believe we can say the bandwidth is 5M now

HugeMan, I don’t know whether your Quad has the same hardware as the mine, but of sure the mine has a -3dB cutoff around 2-3MHz.
Please, specify whether the probe could be so relevant in the test, because I have considered it always in my tests.

I don’t understand what you stated also: at the very beginning of your post you are saying that the analog bandwidth is 10MHz, then at the end you say is 5MHz. What is the correct value?
I’d love to detect a 10-15MHz of real bandwidth. It means inputting a 10MHz @1Vpp sine on the probe and reading around 700mVpp on the display. Being step-shaped, no matter if I read 700mVpp or 750mVpp. On my test I read a supposed 400mVpp!
If you have a Quad granting 10MHz of overall bandwidth, I’ll swap with the mine as soon. I will pay the shipping charge also!

About the sampling rate, I have also detected 72Ms/s and it could be fully acceptable from my viewpoint.
Thanks.

At the risk of insulting you, I disagree with everything you have said in these two sentences. I feel compelled to attack and destroy wild statements that dilute and disrupt positive and valid discussions. We are trying to keep these discussions factual and not based upon opinions. Please provide evidence that supports what you have said. Show us in the source code where these processes that you describe, take place, and what the display buffer has to do with sample rate. Or at a minimum show us some waveform analysis that supports your assertions.

I agree with your statement about separating analog bandwidth from DSO results (sample rate). But then you use the findings of DSO display to talk about 2Mhz bandwidth limit that was discussed in previous post. Cant do that here, cant use DSO results to talk about analog bandwidth.

Agree here also. This is a valid statement.

These are wild and unsubstantiated claims. BenF increased the capture buffer update rate by increasing the sample rate at the expense of decreasing the capture buffer size for each acquisition. This was done for situations where the T/Div sample rate being used was below the ADC max sample rate capability. BenF also never attempted to provide enhanced virtual sample rate for repeating pattern signals. Please stop posting made up thoughts which simply distract from these thread discussions.

Thank you for providing some waveform analysis for this thread. Was the -3db roll-off used to determine 10Mhz analog bandwidth?

While looking at the schematic, U-5 and U-16, I noticed something that appears to be odd. C-21 and C-22 appear to provide a signal ground for the ADC /NOT inputs, yet there are no 105 decoupling capacitors for high frequencies. It is quite possible that these missing decoupling capacitors are contributing to the parasitic issues in the front-end circuits. This may also adversely affect the interleaved ADC operation. Correct me if I am wrong, but these ADC /NOT inputs must be high frequency decoupled if they are to represent signal ground plane. Looking back on the Nano V2 schematic, the ADC portion of the STM used unbalanced input, and the Vref was decoupled inside the STM. Here in the Quad we have the ADC Vref being applied via external traces to the ADC /NOT inputs without high frequency decoupling.

I do believe that this could be a smoking gun for the ADC interleave issues, and may also play a role in the parasitic issues.

--------------- correction edit 16May2011 -----------------------------------
Further examination of the FPGA (U6) caps C21 and C22, finds that I was mistaken when I thought both caps were 22ufd. Instead, both caps are connected in parallel and C22 is a 105 cap which will provide the necessary decoupling. I think my eyes crossed on that one.

I understand that English is not your primary language, but I have to say that you have communicated very well on this topic. I wish I could write in Chinese as well as you can in English.

Technically, you are being conservative with the sine wave signal. Both channels enabled, single channel bandwidth would probably be closer to 7Mhz sample band width (still 10Mhz analog bandwidth) in my opinion. But in real life, because the Quad does not support the SinX display function (it only connects sample points with straight lines), then your conservative value would provide a better looking sine wave that is displayed with straight line connection of the dots.

If the above 10Mhz analog bandwidth measurement that you made was based upon a -3db roll-off, and if the interlaced ADC operation were fixed, then you could get about 10Mhz bandwidth for one channel disabled and 144Mhz sample rate, of course the straight line display dot connections will distort. If the smoking gun fix above is implemented, then that may increase the front-end analog bandwidth above 10Mhz and that would increase the current 10Mhz limit.

As discussed previously in this post, the square wave is a different animal. As described earlier in this thread, the square wave corners are created by the odd order harmonics, and the first 3 odd harmonics are not sufficient to get a reasonable square wave. So the square wave sample bandwidth would be significantly lower to prevent rise time distortion of the square wave which results in the narrowing of the square wave into a sine wave appearance.

Having conducted similar waveform analysis on the Nano V2, I have found that 1/20th sample rate provides a reasonable display, but that display still has rise time issues because of the relationship of the rise time and the Nano sample time limit. These same DSO issues will also apply to the Quad in direct proportion. Therefore the Quad sample bandwidth for a square wave with short rise time will most likely be 72Mhz/20 = 3.6Mhz and 144Mhz/20= 7.2Mhz respectively. If the square wave rise time is longer, then the Quad display will look better.

Have you measured your bandwidth at U5 and U15 pin-3? HugeMan is not referring to displayed results. He is referring to the inputs to the unity gain op-amps that directly feed the ADC.

HugeMan you should repeat your test looking at the op-amp output (input to ADC U-6, pins 3 and 11) because this is a low impedence signal path and will be less affected by parasitics. Unity gain op-amps provide low impedence output and that is why unity gain op-amps should always drive the ADC input pins.

No, I didn’t open my Quad yet.
Anyway it makes to me almost a nonsense by saying about the “analog BW to pin 13…”. The pin 13 is the ADC input!
What else should we count?

OK, on the next week I will try to perform some other tests, even by opening the scope.
Cheers

Hi lygra,

first of all, i want to apologize to you: my last post was not intended to be a tutorial, so i assumed most of the facts i presented were already known.

You can find it in Benf sourcecode (v3.0), function.c, line 402, function void Measure_Wave(void). If you don’t know C, the function description is self explanatory :slight_smile:.
Its also used to help with trigger position (i.e. if trigger is in the middle of screen some points have to be sampled before trigger), signal panning and zoom.

Supposing each pixel is a sample (to oversimplify things) in 0.1us/div and the screen uses 320 pixels for the signal, at 1us/div you will need 3200 samples (using only 1 out of 10) at the same sampling speed to complete the screen. Hence the “just in the limit” of the buffer.
Of course, you can use maximum sample rate even for 10s/div, you only have to decimate signal properly.

unlike you I don’t feel compelled to destroy and attack anything. I’m more the kind of make the love and not the war :slight_smile:. But lygra, a forum is a place to post opinions (and when possible facts) in order to discuss them.

As the source code is closed, only Benf can throw some light over this. But i agree with you that’s irrelevant to the QUAD Bandwidth. My intention was to show that sampling speed is not a key factor if you have enough analog bandwidth. Most cheap scopes use that.
Check this: cp.literature.agilent.com/litweb … 8794EN.pdf

WTF? I’m used to post things i’m pretty sure of. My post was an answer to questions posed by Thanh and not solved by you.
And excuse me again, i wasn’t aware that i was distracting you. You have to focus yourself a little :wink:

My point was that you are comparing apples to oranges. DSO display results are never the proper way to measure analog bandwidth for all the reasons already posted in this thread. Looking forward to your findings when you do open it up, as validation of HugeMan’s findings.

Thanks

Slimfish; Ok, so everything you say is correct and I with my unlimited misconceptions, stand corrected.

I finally found time to research this topic some more. There appears to be a mistake in your calculations here. The first and subsequent odd harmonics for a 1Mhz square wave would be 3,5,7,9,11,13,15,17,19,21,23,25 and 27Mhz to pass the 13th odd order harmonic.

Anything over the sixth odd harmonic of this 1Mhz square wave will be at or greater than -3db attenuation due to the 15Mhz DSO Quad analog bandwidth, so a poor waveform is to be expected because of analog bandwidth limiting.

Another assertion claimed by you and others is that the Nyquist theory only requires 2x of the signal for a sampling rate. You failed to include the rest of that definition which says “a signal must be sampled at least twice as fast as it’s highest frequency component.” With the square wave this would require many odd order harmonics, so in your example above, to include the 13th odd harmonic, then you would require a sample rate of 54MSa/s to reproduce that 1Mhz square wave waveform accurately.

So even if the analog bandwidth could pass the 27Mhz harmonic (and it apparently can’t), then the sample rate would still be destroyed according to Nyquist while using a 36MSa/s sample rate.

If you fall back and say, OK, lets just use a signal generator that can only output the 5th odd harmonic and we know that we will have a slower rise time (less than 10%) source signal waveform because of this harmonic limit. The fifth order odd harmonic of 1Mhz is 11Mhz so the DSO Quad bandwidth can pass this harmonic. According to Nyquist, with fifth harmonic (11Mhz) being the highest frequency component, then 22MSa/s should accurately reproduce the poor quality input signal square wave, and the DSO Quad will reproduce that signal with its 36MSa/s capability.

So, in the end you will get a poor display of a 5th order odd harmonic limited signal input because of the signal itself, and you will also get a poor display of the perfect square wave input because of DSO Quad limitations as described above. As I had mentioned in my earlier posts, my poor quality function generator square wave signal looked pretty good on the DSO Quad because it didn’t have enough odd harmonics present to add the DSO artifacts when the DSO Quad capability is exceeded. When I said it looked reasonable, it did look nearly as good as the input signal with some limited sampling artifacts which resulted in narrowed alternations (10% narrowing at the alternation tops). In the same write up, I also stated that the DSO Quad signal generator signal looked terrible, and now this can be attributed to my other statement about the generator signal looking like a very good square wave up to 8Mhz (which means it has lots of odd harmonics present) on a more expensive o’scope.

The attachments further clarify the above paragraph. You can see that the rise time for the 2nd odd harmonic waveform is about 6% (less than 10% rise time). So we will limit ourselves to the 2nd odd harmonic. This is 5 x 3.5Mhz = 17.5Mhz so it should get through the 15Mhz DSO Quad bandwidth with some amplitude fall off. I also mentioned in previous posts about some drooping of the tops and bottoms and this would indicate some kind of amplitude fall-off. According to Nyquist, the required sample rate would be 17.5Mhz x 2 = 35MSa/s. These numbers clearly show that I could in fact see the 10% rise time 3.5Mhz signal on the DSO Quad (with some amplitude distortion which I never measured).

Now lets look at a 3.5Mhz perfect square wave by your definition (13th odd harmonic is present). 3.5Mhz x 27 = 94.5Mhz analog bandwidth requirement and will not do well with a 15Mhz DSO Quad bandwidth limit. For the same perfect square wave, the Nyquist sampling rate would be 94.5Mhz x 2 = 189MSa/s so that wont happen either. This is why you can’t look at the DSO Quad generator 2Mhz or 4Mhz square wave outputs on the DSO Quad display. It has nothing to do with the DSO Quad being defective, but is simply the result of the DSO signal sampling process while sampling a short rise time square wave.

In summary, in my first post in this thread I stated what I had observed but failed to talk about rise time as a factor for display results. Then Venarim in his first post stated that he didn’t believe that I saw that. And then the thread just rambled on. It is my intention that this post will set the record straight and also explain the reason for differing observations between Venarim and myself.

It also might be pointed out here in the bandwidth discussion, that if the DSO Quad design had a hardware trigger circuit (and it does not) then for repeating waveforms, the firmware could be designed for equivalent time sampling with a magnitude order increase in the maximum observable waveform frequency. That would have made a tremendous improvement to the DSO Quad, but that approach was never taken during the design leap from the Nano to the Quad.

My reference for this post is cbtricks.com/miscellaneous/t … mpling.pdf which is a Tektronics application note for Sampling Oscilloscopes.
1STHAR~1.jpg
2NDHAR~1.jpg
3RDHAR~1.jpg

hi, i promise my hardware is the same as the one in your hand.

  1. i say the "10M"bandwidth i means the input(connector) to the ADC input(U5 and U16 pin13), i say this just want to clarify confusion on the problem(is the input channel or the sample rate the limitation of the system bandwidth ).so ,we can say: the input analog channel bandwidth is 10M.
  2. i say the "5M"bandwidth i means the system bandwidth. i input a signal of 5M (sinewave),and found the wave on the Quad screen is less than -3db. and if a signal of 10M(sine) , the wave is more the -6db.that is : a 10M signal can pass the input channle(gain less than -3db),while it came into the ADC ,because of the sample rate,the whole gain became more the -6db, so,we can not say the bandwidth is 10M.instead,just about 5m.

Hi Lygra,

sorry, but you’re mistaken here. The n-th armonic of a wave is defined as: f_n-th = f * n-th, where f is the fundamental frequency of the wave and n-th is the harmonic. So for a 1kHz square wave, its 5th armonic will be 5 kHz. And zero harmonic is the DC component. It’s true that perfectly square waves doesn’t have even harmonics (and you counted to the n-th position of a odd harmonic), but that’s another tale.

I would say not only, but at least. Difference is significant.

A perfectly square wave has infinite odd harmonics, and hence can’t be perfectly sampled (also produced). With the corrected calculations you will require 30 Msps (15 Mhz x 2). With the arguments you gave in the previous messages… why not sampling 13th harmonic with 20x? So now its enough with 2x?. You are mixing theory and practise, and that’s quite difficult without a solid ground. That was the point to stress.

Although wikipedia says exactly what you posted before, in reality the signal has to be sampled with at least twice its bandwidth to be perfectly reconstructed.

I don’t know how you know this since FPGA is closed source :wink:. But i can bet my mother (only speaking, don’t take me too serious :slight_smile:) that trigger is hardware (obviously is not an analog one, but digital). So QUAD can use equivalent time sampling for sure.

I’d like this thread not to diverge into sampling theory, because its large and complex. So for me, the theory discussion is over.

@HugeMan: I will check the analog bandwidth by open my Quad, as soon I have spare time to do it.

@lygra: I appreciate your effort to demonstrate (better: trying to do it) with tons of theories, but I guess that you are mixing many concepts together.
A square wave is yes composed by odd harmonics (I agree with slimfish about the numbering), but the shapes you drawn could never be what the analog section outputs. You missed a VERY important parameter: the phase!
Remembers that here, for simplicity, we are talking about the modulus of a signal (i.e. a square), but we MUST take in account the phase-shift caused by the analog section. We “should” take in account the phase-shift introduced by the sampling also, but…never mind.

Just take a simple square-wave generator and a R-C lowpass filter. Assuming the time-constant similar to the period, what do you expect to see on a scope?
The input is a square-wave, composed of an infinite number of odd-harmonics. The output cuts them at -6db/oct.
That would be having an output shaped as you drawn?..Yes, if only the filter won’t shift the phase, smoothly from 0 to -90 degrees.
Of course, by scoping the output signal you will see an exponential fragment, repeated on each period. Exactly the same as having a switch charging then discharging the capacitor, via the resistor.
All that only for a simple R-C filter, being just-one-pole complex function. Imagine what would be having a 10+ poles network!

Cheers

I never talked about the fifth harmonic, I only referred to the 5th odd harmonic, not the same. If the first harmonic is even (2Mhz) then the pattern after the fundamental would be 2nd=even, 3rd=odd,4th=even,5th=odd; so the fifth harmonic would be odd and is 5Mhz, but I was referring to the second odd harmonic (which is the actually the 4th harmonic if you count the none existent even harmonics too) when I said 5x, so once again you are mistaken. As you have already said, the even harmonics don’t exist, so they can not be counted. :slight_smile:

See previous response.

My reference was not Wikipedia, my reference was a professional application note produced by Tektronix engineers. If you would bother to read this reference then you may become more informed. As you have already said, the odd harmonics are part of the square wave, and hence the sample rate must be twice the highest odd harmonic expected, unless Nyquist is wrong and you are right.

This is a fool’s bet for someone who doesn’t know the FPGA source code. But that FPGA source code may not be necessary if you look at the STM source code and find it’s triggers source.

I believe that it was you that started with the equivalent time sampling theory, not myself. Sampling theory is not that complex and is explained quite well in the Tektronix reference that I provided in my earlier post. If you look at the Nano post viewtopic.php?f=12&t=1793&start=80 on page 9, BenF fully explains in his May 8th post just exactly how the Nano firmware trigger detection works without a hardware trigger. That discussion is also not very complex. You can also read my Tektronix reference, that also explain exactly how equivalent time sampling works. So I don’t see anything here that is overly large and complex.

The only thing I find complex is trying to determine a hardware trigger within the FPGA, without first looking at the STM source code (which is available) to see if a software trigger is present. An even simpler approach would be to point out the Quad menu choice which provides enabling of this fictional equivalent sampling mode. If the Quad were in continuous equivalent sampling mode, then you could not look at non-repeating signals, but guess what; you can look at non-repeating signals with the Quad. Therefore if you assertion is true, then there must be a Quad menu choice to switch back and forth between equivalent sampling mode and real-time sampling mode. Please be so kind as to point out this menu choice, or stop wasting everyone’s time with your non-validated theories.

What a relief that is. :smiley:
Look, my goal here is not to constantly criticize you, my only goal is to provide factual enlightenment for those looking for same. If you agree to stop spewing theory, then I will agree not to be critical in return. Do some research on your own as I have done, and present those research findings that support your claims. :wink:

Have you measured this phase shift when a 1Mhz square wave passes through the Quad front-end circuits? If so, how much phase shift did you measure for the fundamental, 1st odd harmonic and the 2nd odd harmonic?

When I present a theory, I always use a “maybe” or “might be” during that theory. The rest is not theory but common knowledge of the trade. If you haven’t measured the above phase shift, then it is yourself that is now presenting not tons but ounces of theory.

Thanks