 The length of these posts demonstrates the complexity of these discussions.
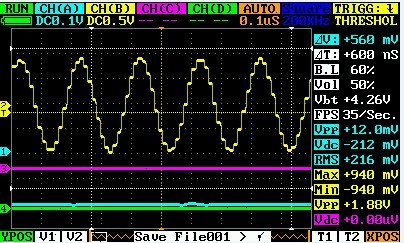
I was implying that less than fastest T/Div selections could result in less than maximum samples-per-second of data capture resolution. This will be further explained in this post. It is very strange that I have NOT been able to find the fastest T/Div capability of the DSO Quad in the specs. Could someone look at their Quad and tell me the fasted T/Div setting available?
We are all trying to learn what we are talking about too!  We are trying to apply our collective limited knowledge to understand, so welcome to the club. In your scope pictures you have 0.5us selected. That is your T/Div = 0.5us selection item in the menu system. What you can’t see is that the T/Div selection may reduce the sample rate. This is because the firmware reduces sample rate (automatically) as you increase T/Div. This is done by the firmware to prevent sample buffer overrun because of too many samples (there is only buffer ram space for 4K samples with both analog channels activated).
As the time per division display of captured data increases (resulting in more time for more samples), then so must the sample rate decrease to prevent capture buffer overrun during that acquisition event. For your benefit an acquisition is simply the accumulation of those 4K sample data points for each trigger event. Each acquisition takes time and this time is mostly based upon the T/Div selection. Once this data capture is completed, then the rest of this acquisition is devoted to very quickly updating the display with the new acquisition data results (new waveform display) for that capture interval, and preparing for the next trigger condition that will stimulate the next acquisition.
Thanks for providing those good screen shots. I must say that this signal is lousy by my standards, and on my engineering model (prior to v2.6 circuit board, that I no longer have) my 3.5Mhz signal was much better looking (an actual square wave was displayed (with some sampling error)). Item (4) below may explain the difference.
I also want to thank you for that link emcsociety.org/Presentations … 0Radar.pdf (first 26 pages) and I will explain why that link is so important.
-
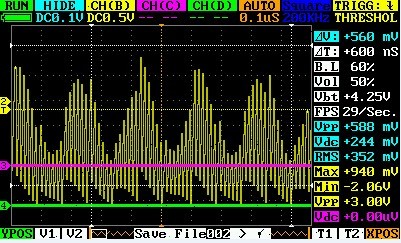
All your waveforms are taken with channel “B” hidden which is reasonable to get the maximum sample rate. The rub is that according to this link, and reports from other Forum threads, the Quad has an ADC interleave problem.
-
I had not considered a clock phase shift problem as a source of the Quad’s interleave problem. I was leaning towards front end ground level and gain differences, but it could also be based upon clock signal propagation phase shift between the FPGA (also within the FPGA) and the ADC chip clock lines. The ADC is physically very close to the FPGA so that is a good start. We don’t have access to the FPGA source code so we don’t know the phase shift relationship of clock signals out on pins 100 and 81. I think it would have been smarter to have used complimentary output pins to eliminate FPGA substrate phase shifts, and they may have; I just can’t tell at this time.
Even with no phasing errors of the two clocks leaving the FPGA, there is still the issue of propagation delay due to circuit board trace parameters. Because we don’t have the board design parameters, then we can’t be sure of the circuit board trace impedences and trace lengths being the same for both clocks. If they are different then that could also cause the ADC interleave problem. The clock signal of 144Mhz requires some serious circuit board trace layout considerations to prevent unexpected propagation delays and reflections.
-
If we want to discuss band-width issues, then the faulty ADC interleave must be removed from the displayed results and this discussion. So keep both channels A & B enabled for all band-with testing until the interleave problem has been corrected.
-
Another interesting link contribution addresses how the rise time of the measured signal influences the DSO results. I seem to recall back when I had the engineering model Quad, that the nice square wave from the signal generator looked terrible on the display but my function generator signal of same amplitude and frequency looked much better. Now I know why: the rise time of the function generator was most likely much longer and this according to the link would result in a better looking DSO display. This is what caused the large difference of my test results versus “Vernarim” test results while using a square wave signal. I hope you are reading this “Vernarim” because that means we were both right about what we saw on the display.

-
Another interesting link contribution on page 7/88 demonstrates how 5x sample rate is barely acceptable while 10x and 20x are much better. 2x sample rate is simply inadequate.
In summary, that link (first 26 pages only, the remaining pages deal with time-domain reflectometry) cleared up a lot of issues for me, and I now have a better DSO understanding because of that link.
To make your measurements complete, you must also provide the amplitude output of the Quad signal generator (using a separate scope) for each frequency just to make sure that the signal generator output is stable in amplitude. Remember, you are only looking at sample points connected with straight lines on the Quad display, so if your sample points never coincide with the peak signal value, then you will never see the peak signal value displayed. This may be the source of the displayed amplitude errors and not representative of analog band-width.
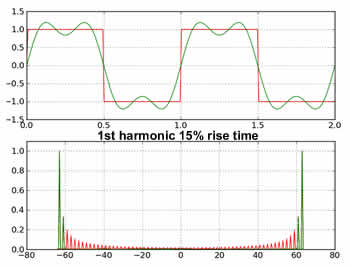
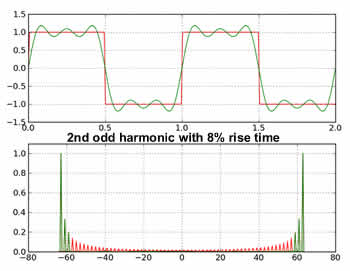
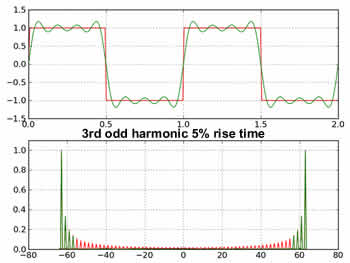
I realize that you were using square waves but we know that a square wave consists of the fundamental sine wave plus all its odd order harmonic sine waves. The attachment to this post is an animated gif that came from an unknown internet source and I modified it in size and slowed it down for the fundamental, 3rd harmonic and 5th harmonic so you can see how peak sample points could easily be missed. Notice how the rise time gets steeper as more odd harmonics are applied to the square wave.
That flat top of the square wave is virtual and composed of a cluster of frequencies (harmonics) so what are the odds that you are sampling on all the peak points? Remember, the trigger condition sets the relationship of the samples phasing with regard to the input signal. If you move the trigger level you should see different waveform results, because the sample phasing of the input signal will change and the odds of sampling a waveform peak also change.
If you look back at my original sine wave drawings, you can see how the amplitude is reduced when the sample is at less than peak position of the input signal, and nearly all the sample points missed the sine wave peaks. With fewer samples per waveform, then these missed peak amplitude samples become more likely. These are the reasons I can’t definitively answer your question. What are the odds that your samples are occurring at the waveform peaks? The answer is probably slim to none with reduced amplitude results. You could ask BenF how the measured peak values are determined by the DSO Nano because that may be how the DSO Quad measures Vpp.
In closing, I expended several hours in researching and writing this post, and I hope that others will take the time to read and understand what I have said here. Is it absolute? Probably not, but it is a good collection of issues that must be considered before determining the analog band-width capabilities of the DSO Quad by using it’s displayed output.
It is unfortunate that several different threads are skirting around in these issues without considering the other threads with similar issues. Maybe this post will help others to recognize all the interactions that can affect the displayed results on the DSO Quad.
 .
.