
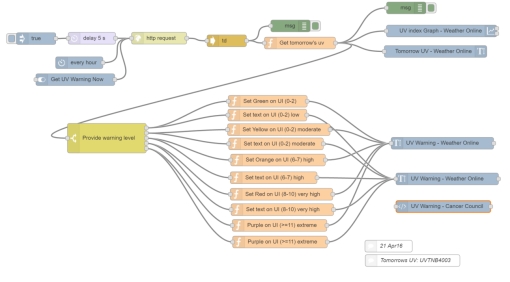
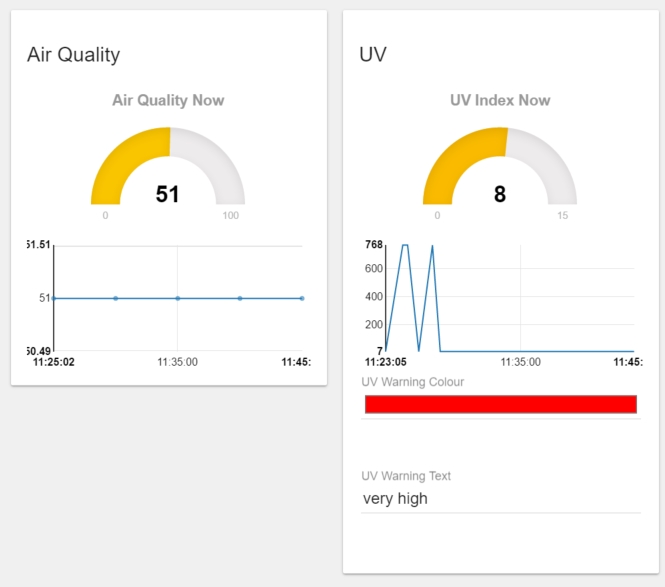
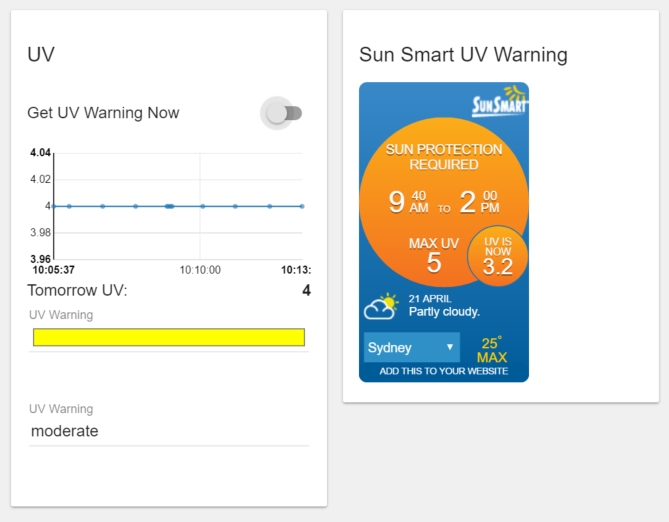
In this posting I am describing a mini project that uses two Grove sensors with two WioLink computers. They are the ultra violet (uv) sensor and the air quality sensor. The reason that two WioLink computers are used is that the wio only has one analog port and I need two. The air quality module is on the Android WioLink app so you can use all results directly but the other module you need to select a generic analog input and scale the measure accordingly. This project is very important to me as I am concerned about both air quality and uv exposure I get when I go for my daily walk. At mid day in mid summer in Sydney Australia it is too hot to go for walk when the uv exposure is at a max. I will latter describe a full recipe for a project that includes the two analog sensors, a timer, data logger and internet search for published uv forecasts. In that future larger project I will use two additional Grove modules - a push button and a sound recorder. The push button will be used at both the start and end of the walk to measure time and uv exposure. If the forecasted uv index is more that 3 the sound recorder will give me a warning to 'put on a hut and use sun protection" at the start of the walk. The uv system will also be linked to my Philips Hue LED lights and they will flash at breakfast with the uv colour warning code as developed by the USA EPA. More on that latter. This mini project is just a warm up and I have used two front end WioLink computers and a Beaglebone Green computer running node-red. The node-red flow starts with a cron scheduler for readings every 5 mins and delivers a gauge and chart for both air quality and uv. In the final project I will log these readings and calculate uv exposure for the day. On a global scale the United Nations has done a good job to negotiate better outcomes for reduced uv exposure but we have not achieved our goal yet. In the Northern hemisphere uv exposures will reach a max in the next 5 years before coming down. In the meantime it is important to be aware of the benefits and risks of uv exposure. This project makes you more aware of it. I only have one problem with the project so far. It is giving me uv readings higher than expected - almost double. I am correlating my readings with the Bureau of Meteorology published measurements and will discuss this issue in the Grove forum.

Aussie do need this kind of project- UV index measurets. Let us know when you have figured out the problem of higher reading…Thank you for the practical projects!
What are those graphing tools you use in the last picture? I’ve seen them a lot but cannot find them…
H ebersteini, the graphing tools are part of the node-red library ui node (user interface). Get them at: flows.nodered.org/node/node-red-contrib-ui